MABs and FIBCONs
There are two specific pattern components at the heart of the Blackbox Trading Edge.
These core patterns were identified as a result of studying the charts in great detail.
MAB and FIBCON patterns form regularly on the charts on all time frames and provide High Probability Trade Opportunities if you can spot them.
The chart pattern comprises of price breaking out from a previous level of support or resistance to make new highs or lows, followed by price retracing to a significant level often confluent with the 50.0 – 61.8 FIB levels – Golden Zone – and/or the moving average where it reverses then continues in the direction of the breakout.
This A-B-C Chart Pattern can be seen again and again on the charts across all markets and with experience can be traded profitably.
We have called these patterns the MAB and FIBCON, where MAB stands for a ‘Moving Average Bounce’ and FIBCON stands for a combination of ‘Fibonacci’ and ‘Confluence’.
These patterns are essentially the same in that they form the A-B-C chart pattern as described, the difference being whether the 21 period exponential moving average is involved at point C where price retraces to and then reverses.
It is important to note that the A-B-C chart pattern is a Pure Price Action pattern that forms due to the confluence of different types of support and resistance. It is not based on candlesticks patterns or indicators.
On occasions pin-bars, inside-bars, engulfing-bars or various types of doji form and are present in the A-B-C chart pattern but from a price action trade setup perspective they are irrelevant.
It is structure that determines the trade entry.
It is structure that determines the stop-loss placement.
It is structure that determines the profit target.
Some traders promote trading the higher time frames only and suggest that the lower time frames such as the 1 minute and 5 minute should be avoided. However, in our experience ‘structure is structure’ and these price action patterns form on all time frames, offering at least 2R trade setups.
We would also argue that trading the lower time frames has its advantages, providing more trade opportunities and increased cycles of learning, which are two of the reasons why we have chosen to Specialize in Trading the DAX Intraday.
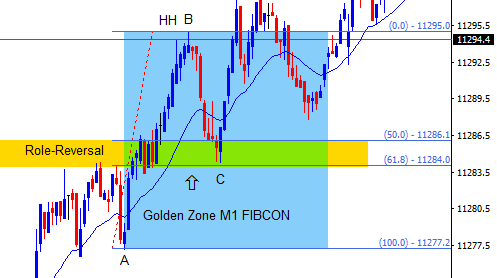
This next screenshot is an example of a specific FIBCON known as a MAB since the moving average is in play.
We call this example a ‘Golden Zone MAB’ since the reversal of price at point C incorporates both the 21 period EMA and 61.8 FIB level.
By definition, all MABs are FIBCONs but not all FIBCONs are MABs.
The important thing to note about MABs and FIBCONs is that price reverses at point C when there is a strong confluence of support and resistance which undergoes a clear role-reversal.
There is a very specific FIBCON chart pattern that we call Reversal FIBCONs or REVFIB which is also incorporated in our Trading Edge.
We have compiled a number of MAB / FIBCON Examples that explain the concept and demonstrate their power and potential.
A-B-C Chart Pattern
Let’s take a look at the A-B-C chart pattern in detail and break it down into its component parts.
Impulsive Move
The move from point A to B is often referred to as an impulsive move or leg where the market moves strongly in one direction covering a large distance in a short period of time, producing a higher-high or lower-low within the context of the current time frame, depending on the direction of the move.
The underlying dynamic is referred to as ‘order-flow’ which relates to the battle between the buyers and sellers. The impulsive leg is the result of order-flow being heavily skewed in favour of the bulls if price goes up or in favour of the bears if price goes down.
It is also known as a ‘Breakout’ when the move is the result of a build-up of Energy. In this case price forms a clearly defined range at zones of support or resistance and eventually ‘breaks-out’ in one direction or the other.
Corrective Move
The move from point B to C is often referred to as a corrective move or leg which forms when the impulsive move eventually runs out of steam and reverses, as the balance of order-flow is redressed.
The corrective leg is a retrace of the impulsive leg. The level at which price retraces to i.e. point C, provides potential trade opportunities when confluent with additional supportive or resistive structure.
It is also known as a ‘Pullback’ when the move follows the ‘Breakout’ from a range as just mentioned. In this case the trade setup is called a ‘Breakout-Pullback’.
Trade Opportunities
Potential trade opportunities are in the same direction as the impulsive A-B leg. Confluent structure must be present to support any potential opportunities.
As traders we should anticipate price movement, not react to it. Therefore once an impulsive move has occurred we need to determine where the market is most likely to reverse i.e. point C.
The method for doing this is as follows: –
a) Mark up any zones of support and resistance on the impulsive A-B leg. Price will often retrace to a zone that previously acted as resistance prior to the impulsive leg breaking through it.
When this occurs the zone undergoes what’s known as a ‘role-reversal’ such that it now acts as support when price retraces to it and effectively acts a floor.
b) Use the Fibonacci Retracement Tool to determine the 38.2, 50.0 and 61.8 levels. If the role-reversal zone is confluent with the Fibonacci levels, especially the 50.0 – 61.8 levels, there is a high probability that price will reverse and move back in the direction towards point B.
The window of opportunity at point C depends on the time frame being traded on which the pattern has formed, in general the lower the time frame the shorter the window of opportunity.
If after the A-B leg forms, price retraces to the role-reversal zone and additional confluence is present in the form of; the 21 period EMA, Fibonacci levels or additional Price Action Grid structure, then our edge is in play.
Trade entry is at point C with the initial target being point B. Good quality MABs and FIBCONs often produce at least 2R trades where the reward is twice the risk.
The Trade Tool can be used to mark-up trade entry, stop-loss and profit target levels with precision and accuracy. It automatically calculates position size ensuring that only the allocated percentage of the trading bank, as defined by the user, is risked on any one trade.
Reversal FIBCONs
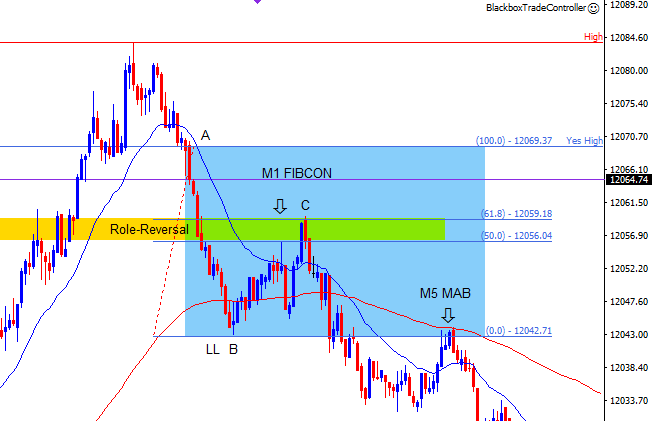
The Reversal FIBCON chart pattern is a very specific FIBCON that occurs when price reaches an area of major support or resistance such one of the higher time frame zone boundaries or the top / bottom of a range.
These areas of major confluence at Price Action Grid intersections offer potential high energy, high probability, high value trade opportunities when price reverses and often result in multiple R trades if price moves back strongly in the opposite direction.
Since Reversal FIBCONs mostly occur at major boundaries, this chart pattern occurs less frequently than the more common MAB and FIBCON chart patterns but when in play the Reversal FIBCON can prove to be extremely profitable.
The key characteristics of the Reversal FIBCON or REVFIB chart pattern and structure are as follows:
- A clear A-B leg forms off an area of major support or resistance with an obvious Higher-High or Lower-Low.
- When the A-B leg has formed the FIB tool can be used to display the Golden Zone.
- The Golden Zone must have an obvious Role-Reversal structure and ideally additional confluence.
- When price reaches the Golden Zone a trade opportunity is on offer, the stop should cover the 61.8 FIB level.
- The minimum target is 2R but potentially a multiple R trade opportunity is on offer if price moves back strongly through the higher time frame zone.
- The best setups produce a high probability M5 MAB trade opportunity at point B so can be traded down/up to the Golden Zone and generally the trade has 2R potential.
- Due to context the M1 MAB is low probability since price is moving up/down off a major boundary.
We have compiled a number of Reversal FIBCON Examples that explain the concept and demonstrate their power and potential.
Identifying High Probability Trade Opportunities
Trading is all about probabilities and no trade is ever a dead cert. However in our experience, high energy, high probability trade opportunities occur when our trading edge is in play and the more confluence the better.
High probability setups can be identified when: –
- An obvious, distinct impulsive A-B move occurs forming a higher-high or lower-low depending on the direction of the move, within the context of the current time frame.
- A very clear corrective B-C move follows which retraces to chart structure that is confluent with at least one of the key components that combine to form the Price Action Grid: –
- As mentioned previously, the more components that are confluent the better.
Waiting patiently for an impulsive-corrective A-B-C chart pattern acts as great filter since you either have one or you don’t!
The A-B-C chart pattern is the result of a build-up and release of energy which happens repeatedly on all markets and all time frames. Learning to identify and trade this pattern will come with time and experience and can potentially be very lucrative.
Fibonacci Retracement Tool
A Fibonacci retracement is a term used in technical analysis that refers to areas of support or resistance. The Fibonacci retracement tool or FIB tool is used by many technical traders to help identify these strategic areas that often become the new support and resistance levels after a significant price movement up or down.
The FIB tool uses horizontal lines to represent the key Fibonacci levels and identify these potential new areas of support or resistance before the trend continues in the original direction.
We have been fascinated by the subject of Fibonacci which came up regularly in the trading systems we evaluated and when studying the charts. It became clear that it was a subject that caused much confusion amongst traders such that it was often dismissed as being unreliable and irrelevant.
As mentioned, it can be very subjective and it can often be confusing as how best to mark up Fibonacci levels on the charts. A common misconception of traders is to draw the 100% retracement level from where they think the move began, so they typically choose the highest or lowest point of the first candle.
Fibonacci structure is a building block and as such it needs to be built on a solid foundation. Therefore it is logical that the 100% retracement level or reference point would be a predefined level of support or resistance, which may not necessarily be the highest or lowest point of a move.
During our studies we experimented with the FIB tool and found that when we used these known reference points, the chart patterns tended to be more precise and therefore led to higher probability trade setups.
When characterizing the reoccuring price action chart patterns we had observed, we found that the 50.0 and 61.8 Fibonacci retracement levels – the Golden Zone – were often in play, and led to potential high energy, high probability, high value trade setups, especially when confluent with other key components of the Price Action Grid.
We concluded that the 100% retracement level should be taken from one of the following:
- Top or bottom of a key horizontal zone
- Top or bottom of a bull or bear channel
- Intraday key levels
- 21 period exponential moving average
In other words, the active component of the Price Action Grid, which in this case is Yes High.
Professional traders and computers base their decisions on known reference points i.e. predefined levels, some of which are obvious such as the intraday key levels, but others like horizontal or sloping support and resistance need to be accurately identified, which takes time and comes with practice and experience.
It is important to point out that this is not a ‘force-fit’, it is about using common sense and the key components of the Price Action Grid to determine the most logical reference points based on price action and chart structure.
This video by entrepreneur, peak performance trainer and stocks/FX trader Adam Khoo, starts by explaining a little bit about the history of Fibonacci numbers and ratios and how they are embedded throughout nature, architecture and biology.
He goes on to demonstrate the power of Fibonacci retracement levels on the charts and how they act as support and resistance as price moves up and down. He explains how traders can use the Fibonacci retracement tool as an additional confluence to identify high probability trades when trading with the trend.