10:54
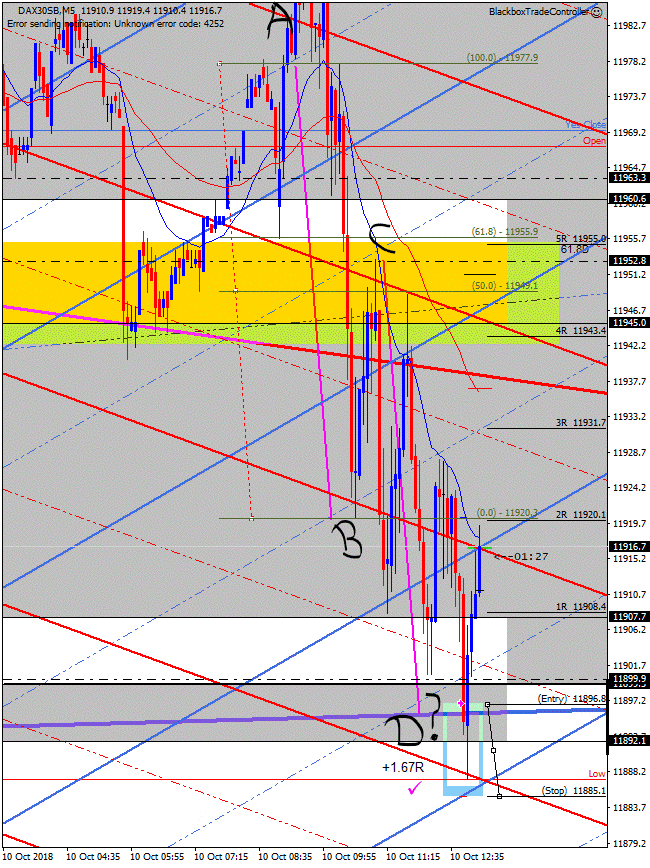
Buy at SUPCON +1.67R
After many setups where I was close to enter but waited probably too much for the exact entry level, I marked this one well in advance, waited patiently (doubted a little bit as well) and went for it.
Note the magenta coloured lines availables on the Expert Advisor as Measured Move. The idea is to somehow estimate the lenght of a trend by taking the distance from A to B in any successful setup (fibcons & mabcons that worked out) and apply it from point C to the next stop, marked as “D?” as we don’t know exactly what the market will do.
So I waited for the trend to reach point D, coincidentally a very important level as the Daily Bull channel might be a place whe price looks for support before retaking its bull trend, and decided to buy. I was close to be taken out as the movement down was aggressive, but fortunately my stop loss was low enough to give room to such movement.
I could have left the trade reach its original 2R level but the 5min Moving Average was being quite strong as a ceiling over the last 90 minutes, so after allowing price to test it twice I opted for securing profit.
As I write this, price managed to brake that level and went for the 15min Moving Average! That’s the life of a trader!


A great buy trade!!
The poke below the D1 bull channel ad the 11900 level was a bear trap, the setup was good, well done.
The Hourly chart and the H1 EQZ level at 11899.9 was very supportive of the buy trade, I should have also been on it 🙂