Pure Price Action
Over recent years, ‘Price Action’ has become a trendy buzz term that has been hijacked to promote various approaches to trading, and therefore can mean different things to different people. Some of the information we present will challenge those of you who have invested time and money in trading systems based on various indicators and candlestick patterns.
Blackbox promote and apply ‘Pure Price Action‘ when trading the markets.
Pure Price Action: ‘the language of the charts‘ speaks only of structure.
This chart structure consists of ‘Support and Resistance‘ in all its forms.
Pure Price Action patterns form due to the confluence of different types of support and resistance, therefore we enter trades based purely on chart structure, not based on ‘signals’ generated by indicators or candlestick patterns.
It is structure that determines the trade entry.
It is structure that determines the stop-loss placement.
It is structure that determines the profit target.
There are many traders who combine price action with various indicators and/or candlestick patterns, however we have found this approach to be unreliable. In our experience, it is chart structure that determines success or failure – not whether a pin-bar, doji or engulfing bar has formed or one of the many available indicators is at a certain level.
An A-B reversal pattern on the 15-minute chart can look like a pin-bar on the 30-minute chart. What’s really going on and what’s really important is that price has encountered either support or resistance.
Depending on the broker, the 4-hour charts and candlestick patterns can be subtly different since they may have different opening and closing times for the candles. Therefore, if a trader is relying on the formation of a particular candlestick pattern on this time frame to signal trade entry, then that will vary depending on the broker and charts being used.
Below are two 4-hour charts from different brokers that illustrate this point. Each show the same time period during Feb/Mar 2019, however there is a one hour difference between the open and close time of the candles.
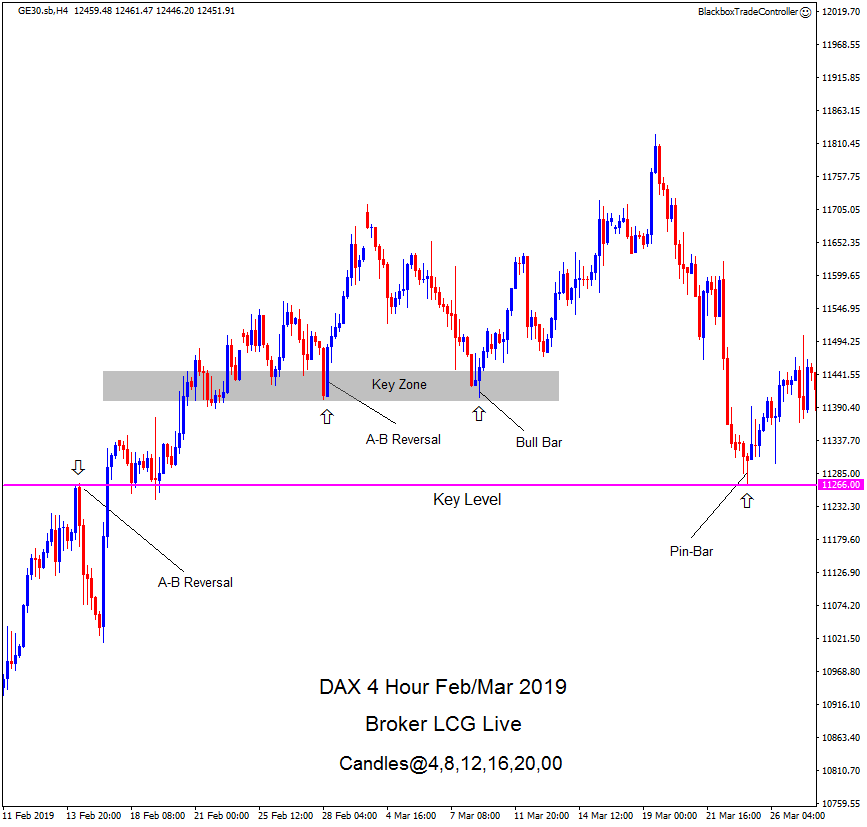
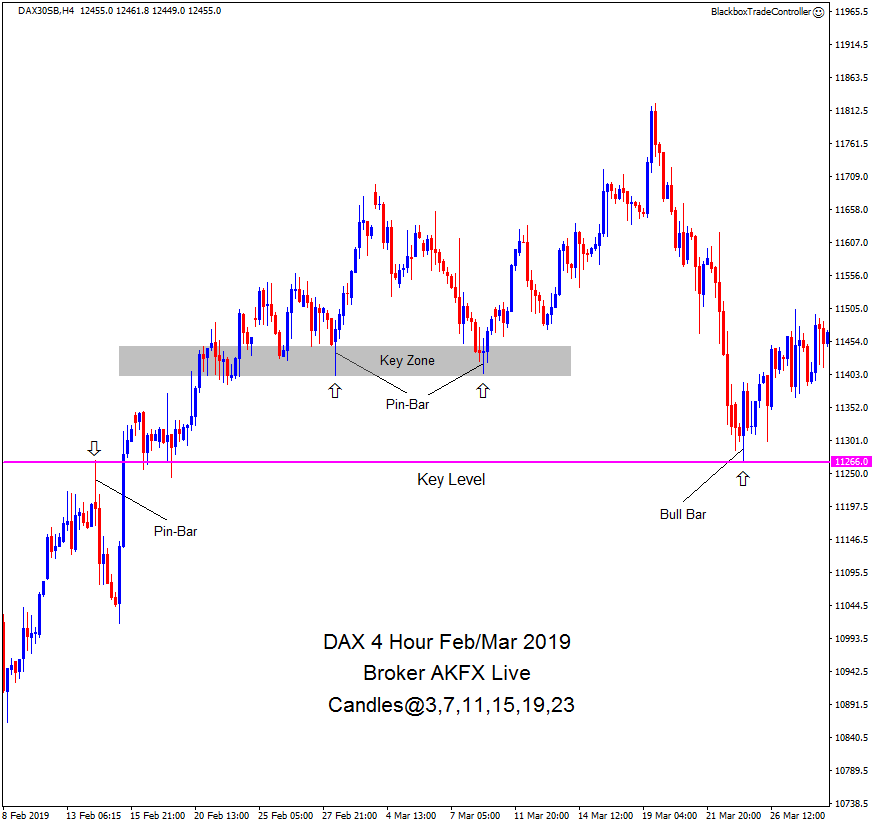
There are four arrows shown on the charts that highlight where price found either support or resistance at chart structure; the magenta line is at the 11266.0 level and the other is a silver coloured short-term Key Zone.
As the charts show, there are subtle differences in the candlestick patterns that have formed but what is important to traders is how price is respecting and reacting to chart structure, not whether a pin-bar, doji or any other type of candlestick forms during this period. This is why professional price action traders think only in terms of support and resistance.
Let’s further clarify this point with a thought exercise… imagine that there are three brokers and each open their 15-minute candles 5 minutes apart; the first on the hour, the second at 5 minutes past the hour and the third at 10 minutes past the hour, and so on. The candlestick patterns displayed on the 15-minute chart for each broker would inevitably be different.
However, as and when price reaches a zone of support or resistance which takes several hours to resolve, regardless of the candlestick patterns on the 15-minute chart, price would be contained by the zone in the same way when looking at the 4-hour chart.
Can you see why trading candlestick patterns is meaningless and unreliable compared to trading chart structure in the form of support and resistance?
Once a trader has learned to accurately identify and mark up chart structure, they learn to trust it and have the confidence to enter trades at precise levels which offer great value in real-time, as opposed to relying on signals generated by indicators or candlestick patterns which lag the price and often result in poor value trade setups.
At its purest, price action trading is based on order flow, the battle between the buyers and the sellers, resulting in zones of support and resistance which can be both horizontal and sloping, and can be applied to any market on any time frame.
When price interacts with these zones, we wait patiently for specific chart patterns to form where our Trading Edge is in play, we mark up our charts and if our trading rules are met, we take the trade.
The following video shows a trade that resulted in a +2.00% winner which was based on pure price action. It demonstrates how chart structure from different time frames was used to determine trade entry and trade management.
This is a great example of Pure Price Action where the trade was anticipated prior to the 7am GMT European Open and was based solely on chart structure, soley on support and resistance.