It's All Energy
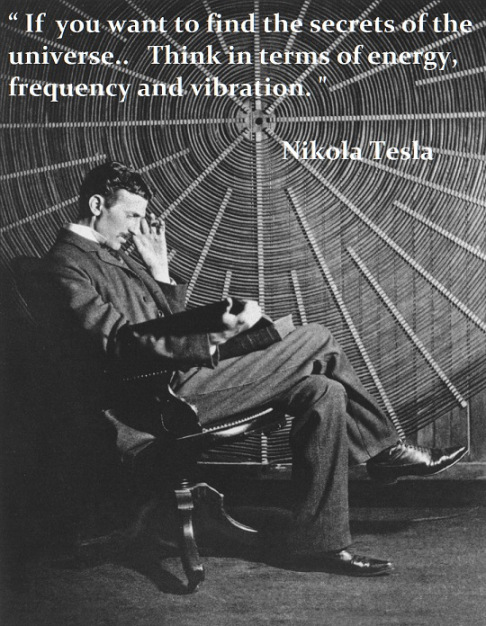
One of history’s greatest inventors was Nikola Tesla.
He had a profound understanding of the ‘energetic soup’ we all swim in. He encouraged people to study the energetic properties in all things, both visible and invisible.
How does this relate to trading?…
Pure Price Action is based on an understanding of chart structure and what holds any structure together?.. Energy!
Chart structure can be defined as support and resistance in its different forms: –
- Horizontal and Sloping Support and Resistance
- Fibonacci Retracement Levels
- 21 Period Exponential Moving Average
- Intraday Key Levels

All of the above act as energetic fields and barriers to price as it moves up and down, such that when price interacts with them it does one of two things; if it has enough energy it will break through them and continue in the direction it was going, or if not it will stall and may even reverse.
The Price Action Grid has been designed to overlay structure or in other words these energetic fields and barriers, and project them into the future to provide guidance as to potential high energy, high probablity trade setups i.e. when the build-up of energy is released.
The A-B-C wave or ‘Impulsive-Corrective Move’ which is a common charactistic of both the MAB and FIBCON chart patterns, is a release of energy into the market which must play itself out, it’s a simple matter of physics, the principle of cause-and-effect.
This energy comes in the form of ‘order-flow’ where either the buyers or sellers overwhelm each other for a period of time and break through Grid structure. This produces patterns on the chart that can lead to high probability setups, where a Trading Edge is in play for a limited period of time.
Confluence

Confluence is defined as “a flowing together of two or more streams, rivers, or the like”.
Support and resistance in all it’s forms can be thought of as ‘rivers of energy’ which combine to produce a high energy, high probability event.
Therefore, the Price Action Grid, MABs and FIBCONs can be thought of as ‘energetic structure’ that forms on the chart.
This video by entrepreneur, peak performance trainer and stocks/FX trader Adam Khoo, does a great job of explaining the concepts of chart structure in terms of support and resistance in all its forms.
He emphasizes the power of confluence when trading the markets and demonstrates how probabilities are significantly increased when it’s in play.
