Area Status Tool
The Area Status Tool enables the remote, real-time monitoring of every WSC production system on the network, providing visibility of test results and all activity on the production test floor. It provides production metrics that can be used for capacity planning and production targets.
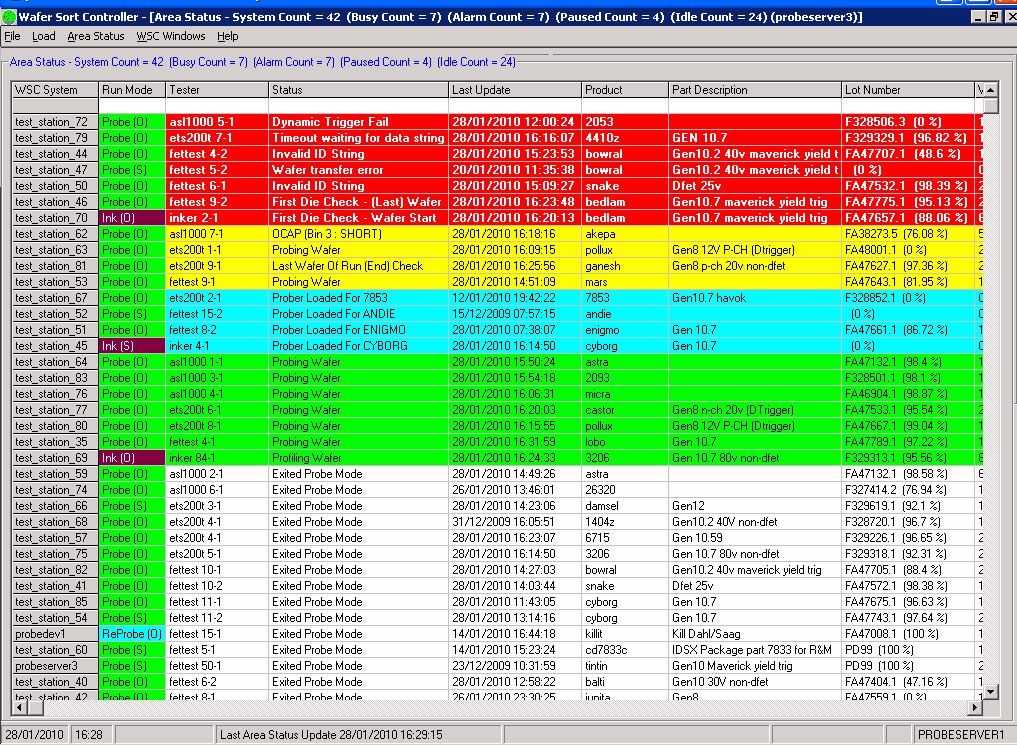
It displays the real-time status of every WSC production system on the network and uses a colour-coded traffic light system enabling the user to quickly assess activity on the production floor, an extract of which is shown below.
The Area Status Tool can be configured in either Engineering or Production Mode, with the Production option set-up to focus on Production metrics and provide time and motion data. This data is extremely useful for capacity planning and in the understanding of why targets have not been met due to unforeseen problems.
The Area Status Tool provides the ability to configure and group systems into cells, this is reflected on the Area Status display where the user can choose to view all cells or particular cells of interest.
It also provides the ability to ‘drill-down’ to any WSC production system on the network and view all system activity in real-time. This extremely powerful feature allows engineering and production personnel to remotely monitor any system of interest from their desk, enabling them to see exactly what the operator running the system can see, as if they were attending to the system themselves.
Engineering Mode
When the Area Status Tool is configured for Engineering mode, the WSC production systems are grouped together and displayed in order of priority as described below.
- Red
These systems are displayed at the top since a red entry indicates that the system is alarming and requires attention. - Yellow
These systems are displayed next since a yellow entry indicates that the system is paused while an alarm is being attended. - Cyan
These systems are displayed next since a cyan entry indicates that the system is set-up awaiting a new lot. - Green
These systems are displayed next since a green entry indicates that the system is running without any problems. - White
These systems are displayed at the bottom since a white entry indicates that the system is not being used.
This display makes it very easy for engineering and production personnel to assess the status and activity of every system on the production test floor, immediately highlighting what systems require attention, thus increasing efficiency and productivity.
In addition, the operating metrics are displayed alongside each system entry providing detailed real-time information relating to the lot being processed, the current status and the hardware configuration in use.
Production Mode
When the Area Status Tool is configured for Production mode, the WSC production systems are grouped together and displayed in order of priority in the same way as in Engineering mode.
Alongside each system entry, comprehensive production metrics are displayed in real-time, with time-associated metrics displayed in hours, minutes and seconds.