Friday 13th
09:54
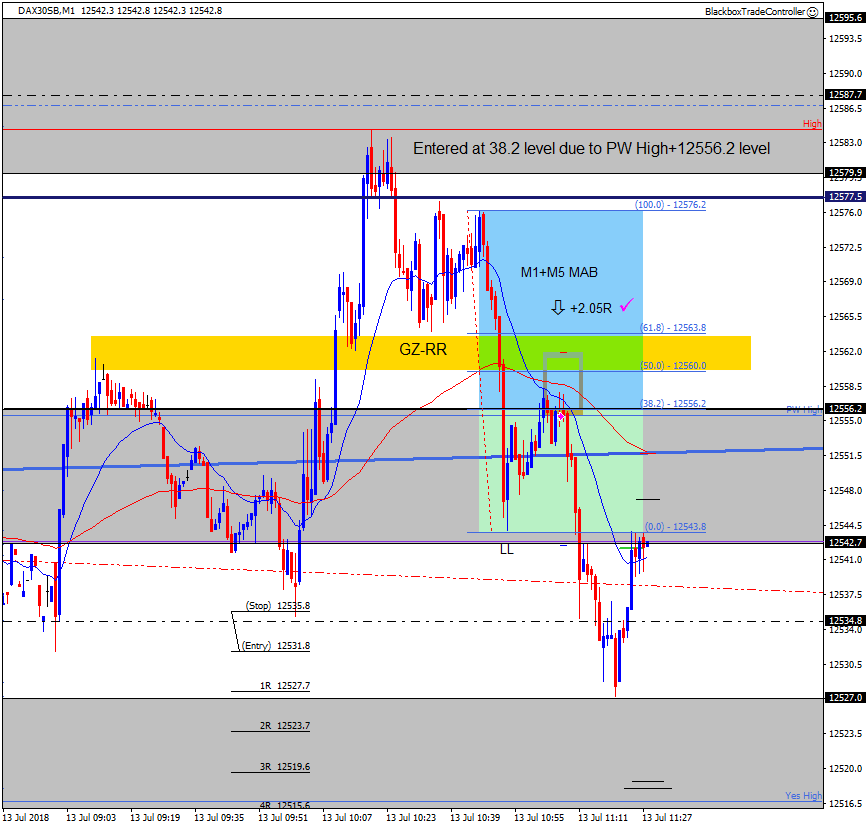
M1+M5 Sell MAB Winner
A bullish start at 7am and also at 8am resulted in price testing the daily keyzone lower boundary at 12577.2 to form the current sesssion high.
Price sold off after failing to hold the level to produce a clear impulsive A-B leg. The GZ-RR zone was my preferred entry level but when price struggled to get back above:
- PW High
- Hourly keyzone boundary at 12556.2
- M1+M5 MA’s
I entered at the 38.2 level as shown.
It was a 100% WTA and on this rare occasion I entered earlier than planned.
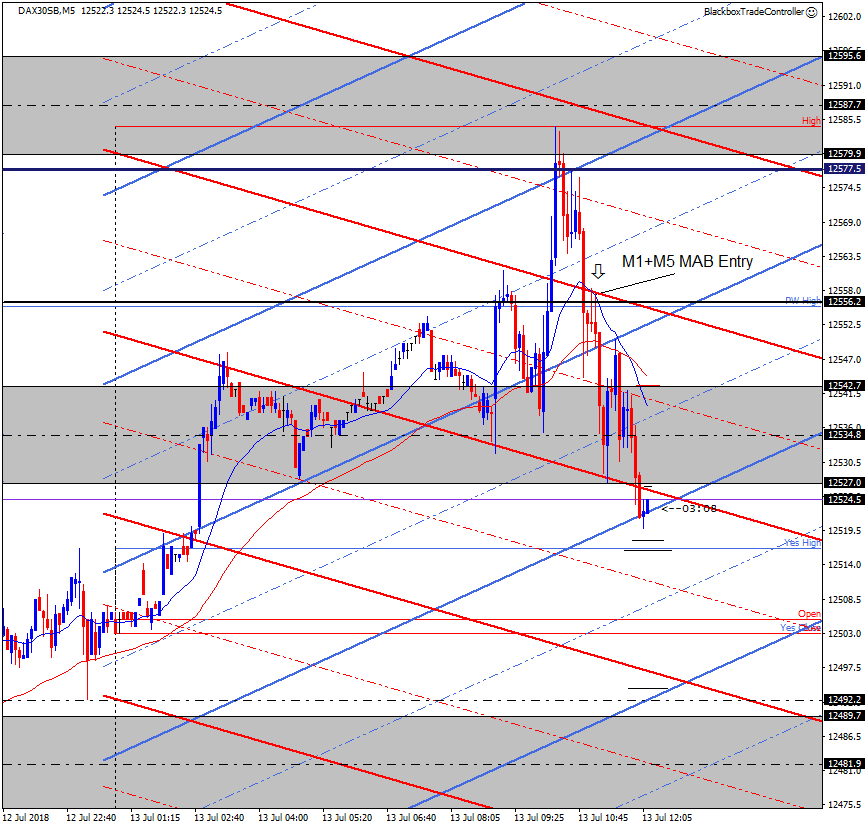
Below is the 5 min chart, note how it was supportive of the trade entry at that level due to the bear channel.
Thursday 12th
08:38
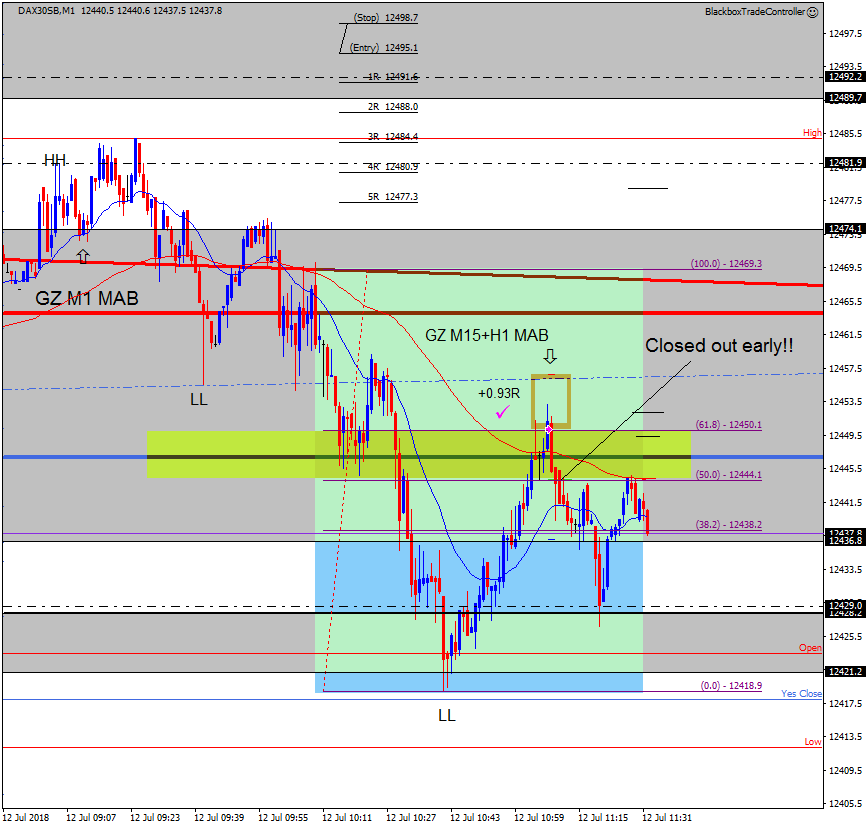
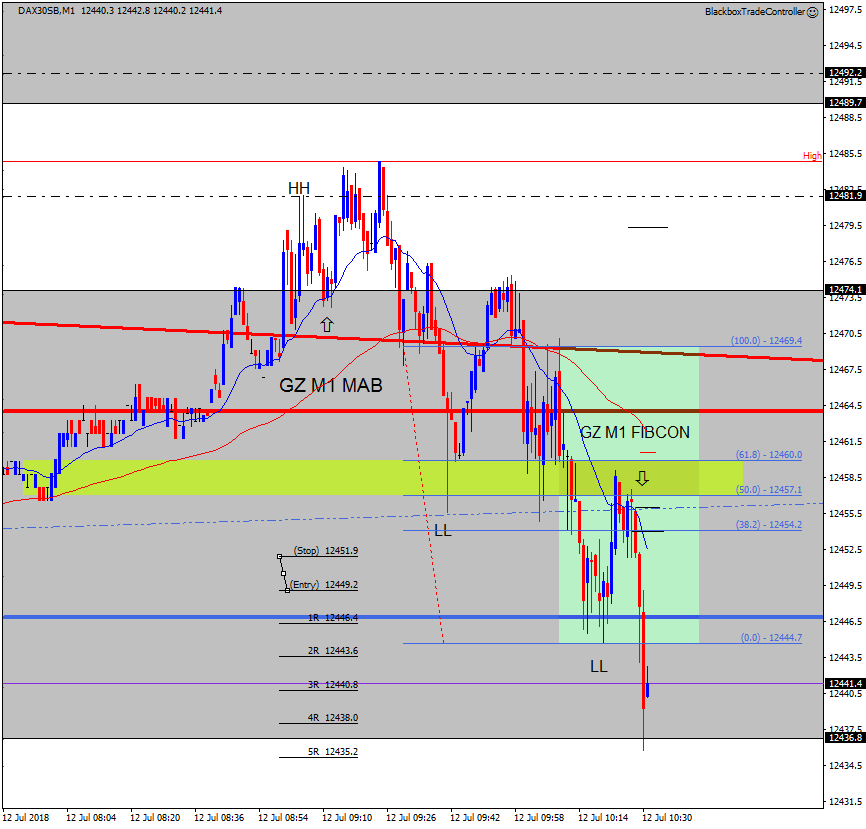
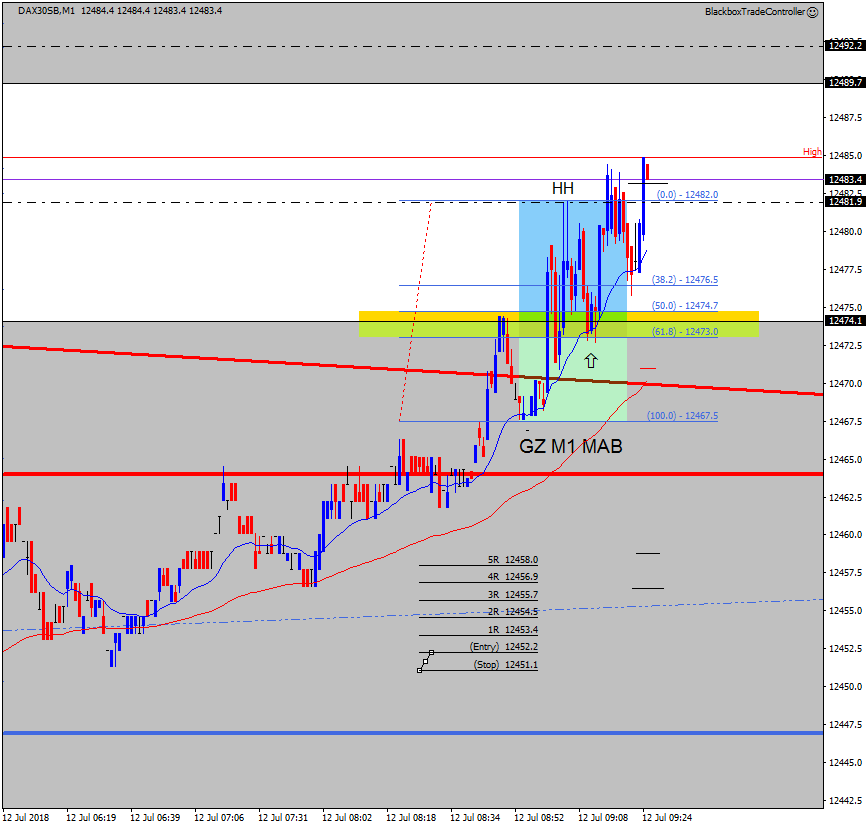
GZ M1 Buy MAB + GZ M1 Sell FIBCON
Two decent setups below that I didn’t take. Maybe I’m a little distracted due to the drama of last nights semi-final 🙁
Was VERY close to taking this but I talked myself out of this decent Sell FIBCON as price was reversing up off a daily bull channel. Price has since sold off down to the Open.
I passed on this very early M1 MAB just after 7am. Structurally it was good, the GZ-RR was excellent.
Wednesday 11th
14:50
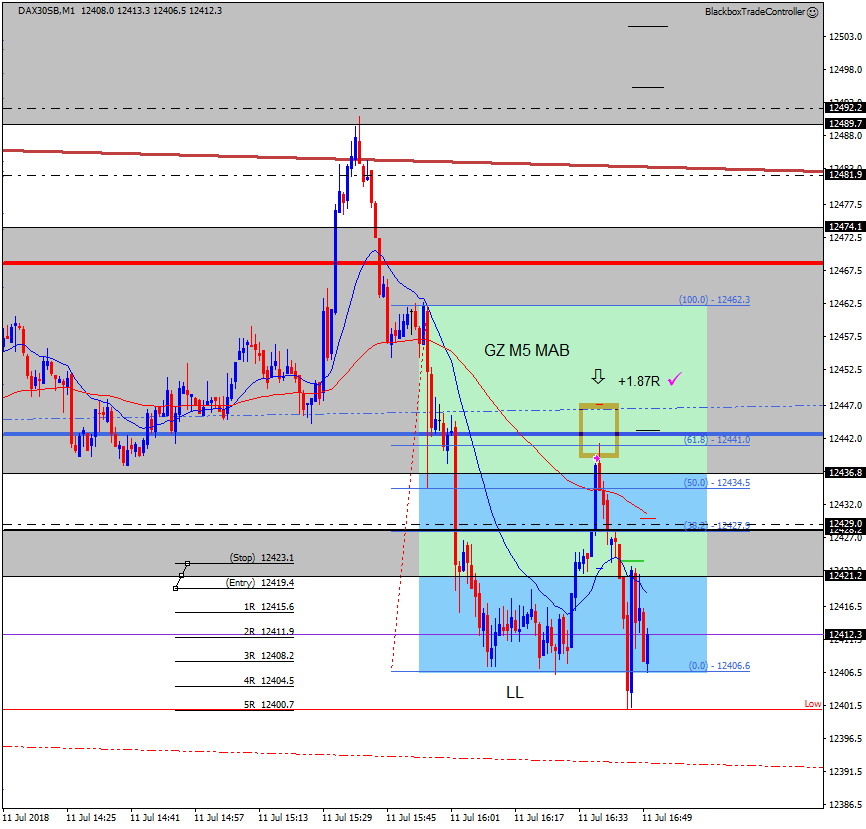
GZ M5 Sell MAB
After the early sell off price went into a range that was best avoided. I decided that if price broke below the bottom of the hourly keyzone at 12428.2 I’d consider a sell if the setup was good.
That finally happened at 14:00 so decided if price retraced into the GZ I take it. The 5 min keyzone looked the best at 12436.8
I did lower my target and trailed my stop to the original 2R level, it was at one point +4.80R but then a bull spike took me out for +1.87R.
Very pleased with the setup, very pleased that I waited patiently, a 100% WTA.
Price has since moved down and hit my 5R target 🙂
Tuesday 10th
15:47
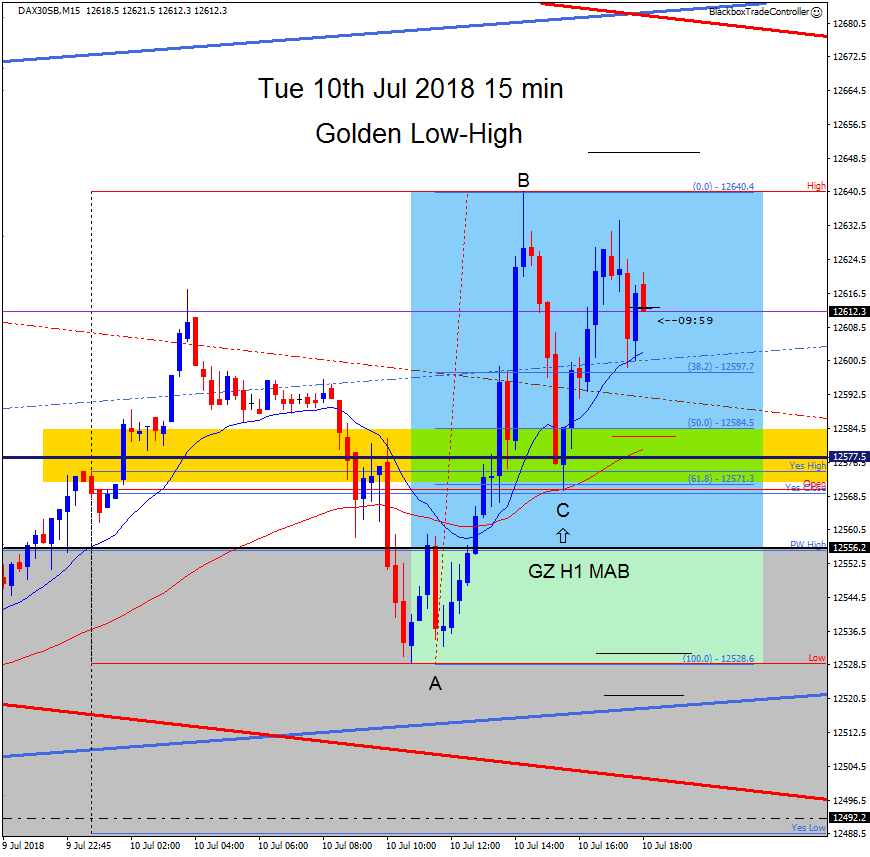
Superb Golden Low-High Buy Setup
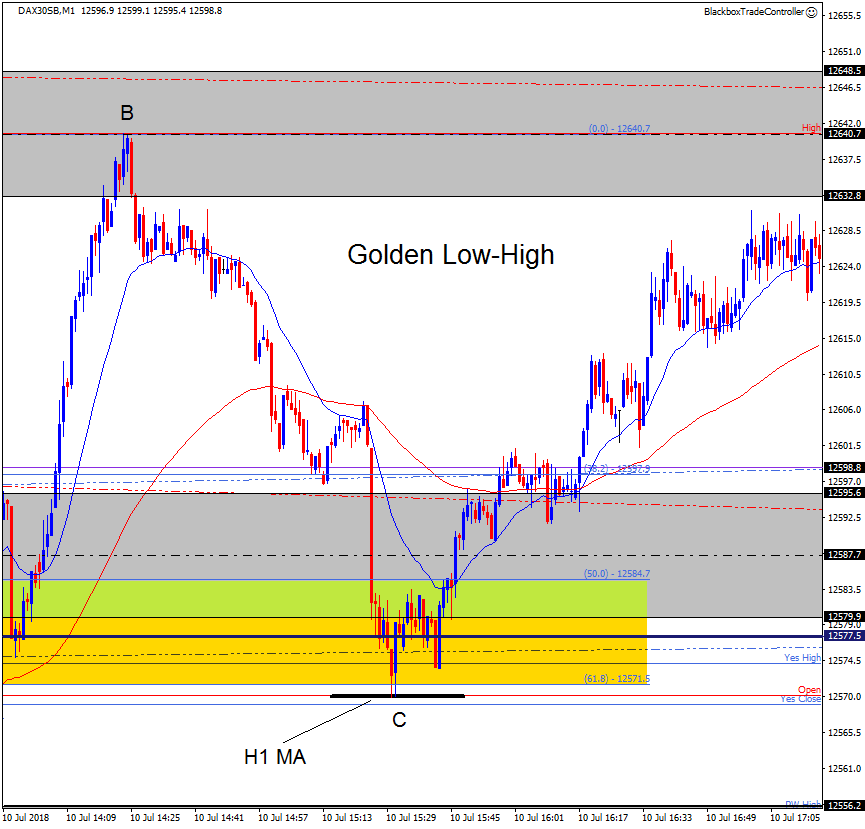
This is a great example of a Golden Low-High setup where point A is taken from the session Low and point B from the session High.
We’ve seen these in the past but now is the time to start looking for them. They occur regularly throughout the month, what we don’t know is the day and time. We need to make them part of our mindset and reasoning process during the session!
The sell off from the high retraced into the Golden Zone (point C) and was confluent with:
- The 61.8 level at 12571.3
- The Daily keyzone boundary at 12577.5
- Yes High
- The Open
- The hourly MA
This was a superb setup with multiple R potential as shown.
The very best ones usually have the Open in or close to the Golden Zone which makes sense from a structural POV.
Below is what the setup looked like on 1 min chart. The skill is entering a buy trade in real-time as close to point C as possible. Price bounced perfectly off the H1 MA and the Open before moving back up strongly.
In the past I’ve traded a few of these with some success, now is the time to master them. This one is exceptional and I wish I’d been at my desk.
10:14
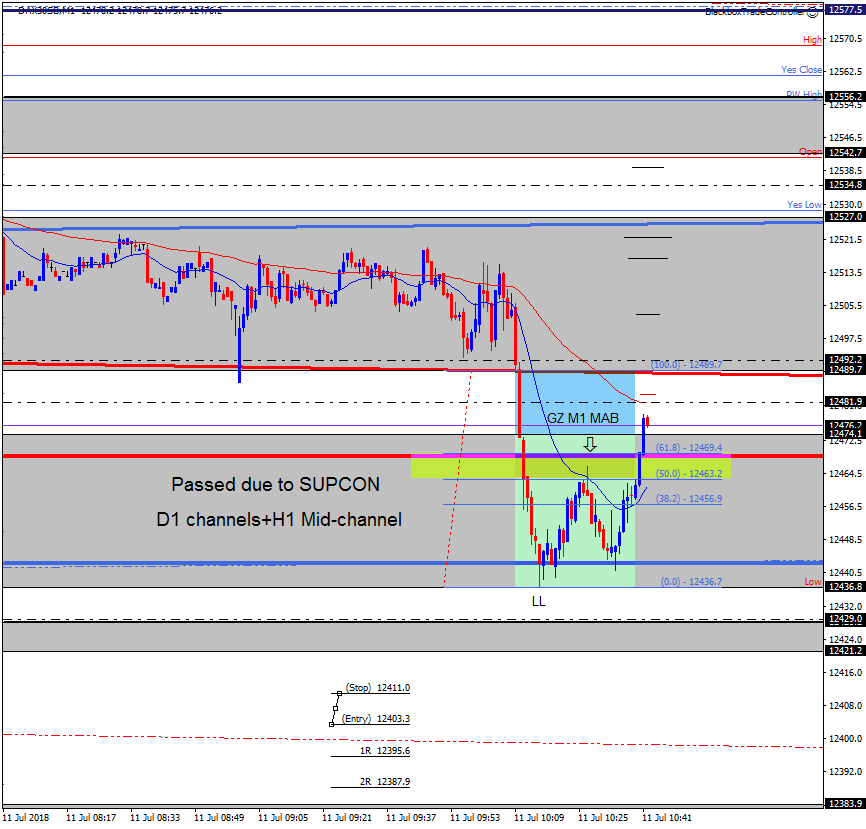
GZ M1 Sell FIBCON Loser+Winner
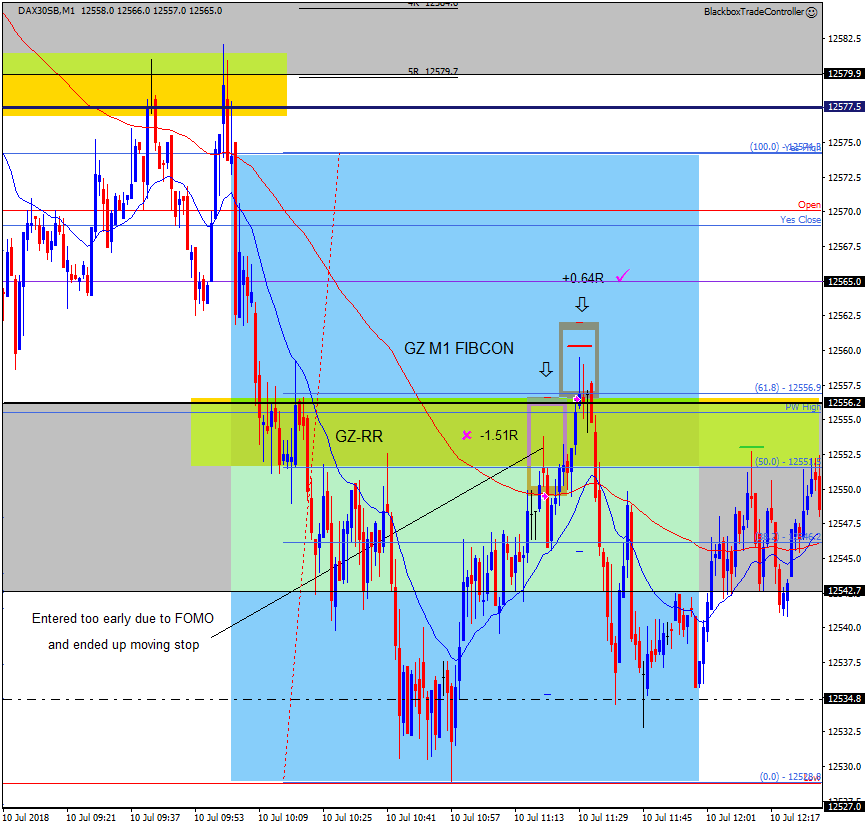
The screenshot shows two sell trades, one loser, one winner.
Point A was taken from Yes High which resulted in the 61.8 level being confluent with the PW High+top of the hourly keyzone at 12556.2
FOMO meant I took the early entry and ended up moving my stop to cover the PW High. I was stopped out by 0.1 of a pip!!!!
I quickly reassessed the setup and entered again, this was the ONLY entry I should have waited for.
I was really pleased with the quality of the setup and my anticipation so 100% WTA.
However, I moved my target to just above the Low. It looked good then reversed, I rode out the ups and downs only to be stopped out for a +0.64R winner.
So, great setup as shown but due to FOMO, moving my stop and being too aggressive with my target I’m net down -0.87R.
Monday 9th
11:54
Sell loser analysis
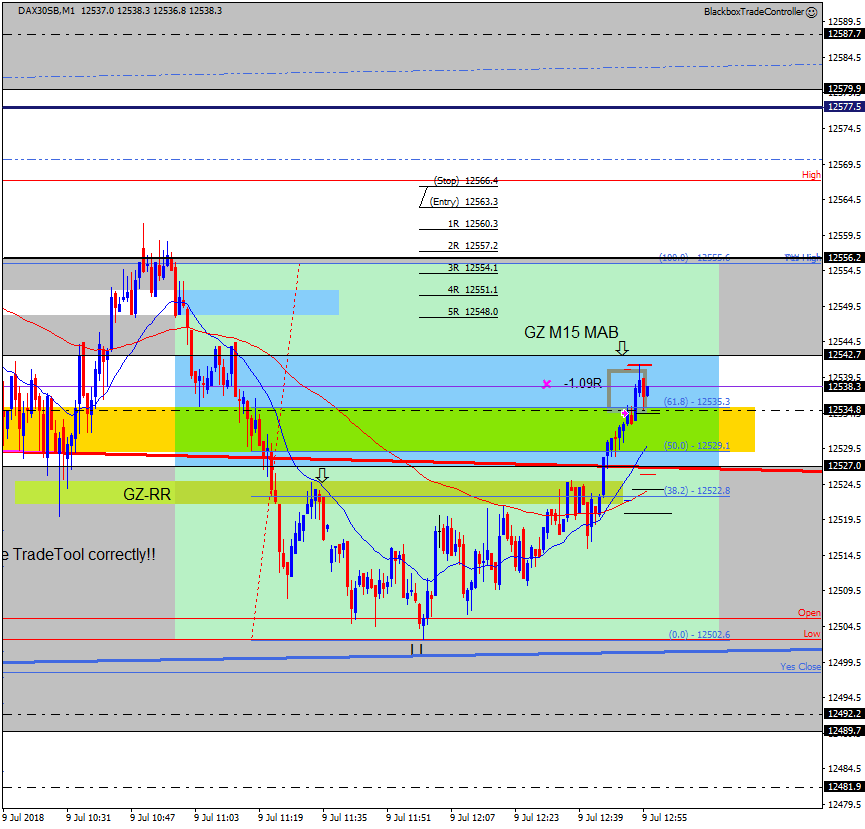
I’ve looked at the Grid structure and can clearly see that had I paid more attention to the 5 min chart and ‘Looked-Left’ I might well have reasoned it was better value to wait for price to reach the 12542.7 level.
Always easy afterwards but I must admit I’ve been working on the blog and allowed myself to become distracted thus resulting in me not reasoning the setup out correctly.
Once again, total concentration is required!!!
11:33
GZ M15 Sell MAB Update
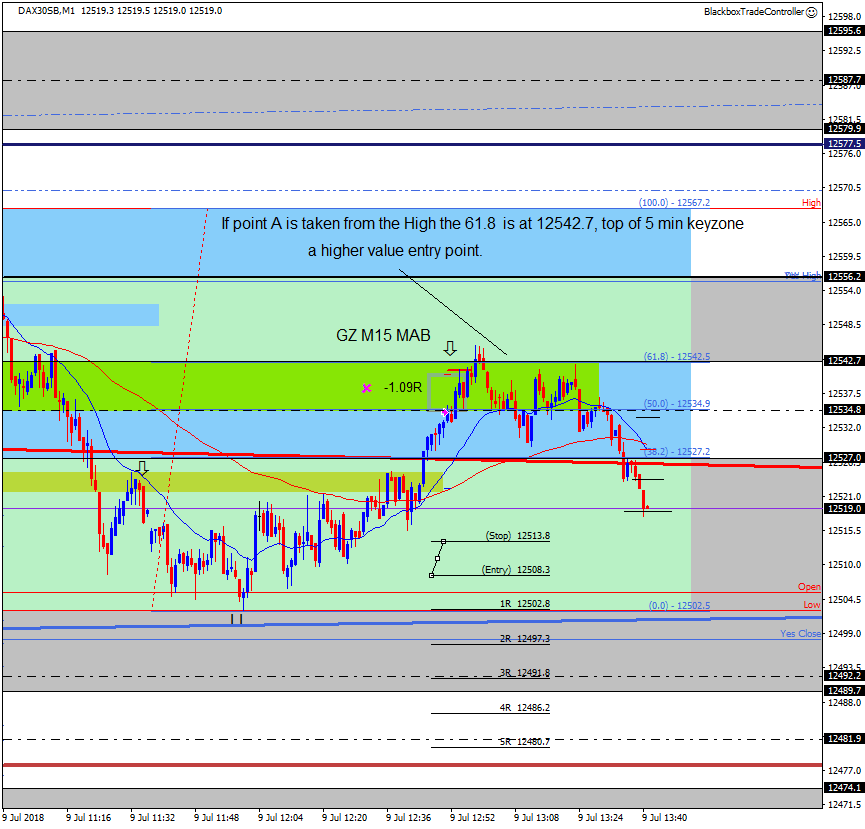
A Golden High-Low….
If you take point A from the High the 61.8 is perfectly confluent with the top of the 5 min keyzone at 12542.7, this is something we’ve called a Golden High-Low in the past.
Price has broken below the hourly bear channel so the 2R would come in had I used the high as point A and entered when price tested the 61.8 level.
11:16
GZ M15 Sell MAB Loser
Took the M15 MAB but did not work out.
I almost talked myself out of it because price had just broken back above the hourly bear channel.
The GZ-RR was decent but overall I would pass on this next time. Price has since gone on to test the channel then entered a short term range.
The 15 min chart shows how price has bounced strongly up off the Open and hourly bull channel.
09:50
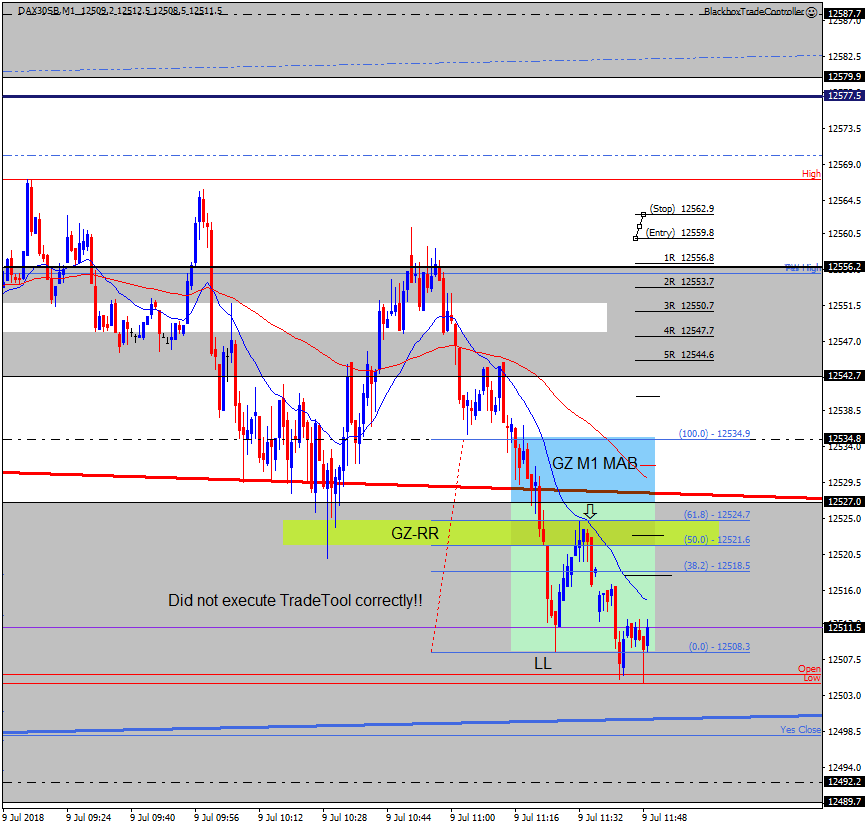
GZ M1 Sell MAB
I waited patiently for a decent setup and entered the sell but I did not press the Ctrl-E correctly. In the moments after whilst I was checking if it was delayed for some reason price moved down and the value was gone.
It went on to be a winner but I’m pleased that I was The Bear and waited for it to form. I felt price might still want to test the Open/Low and hourly bull channel.
This played out so it’s a 100% WTA, just need to make sure I press the Ctrl-E correctly.

