Friday 20th
20:07
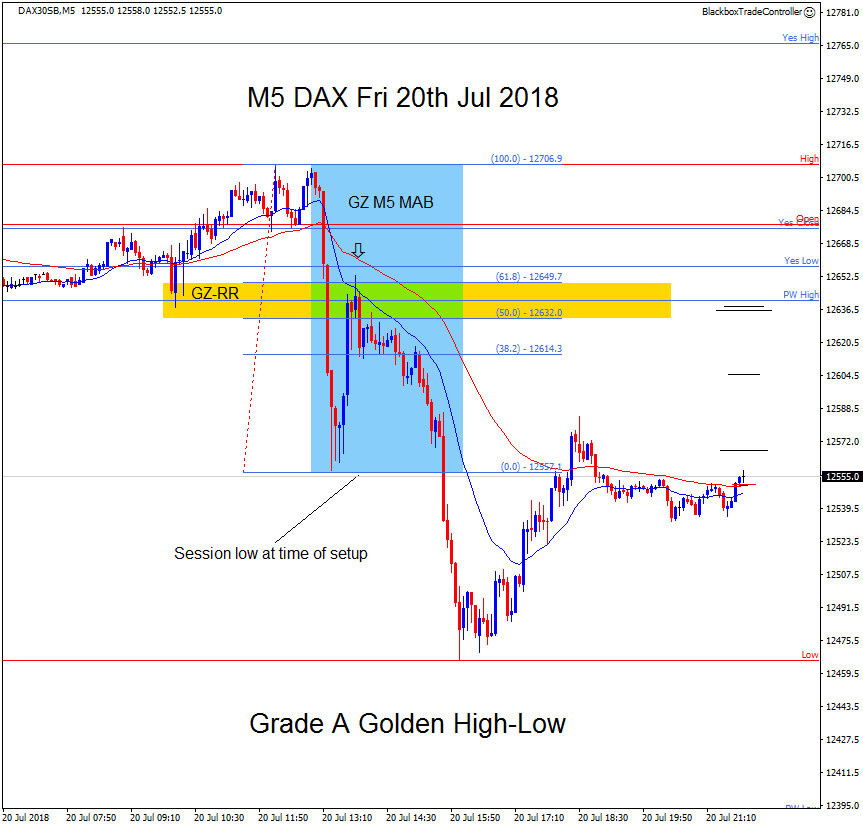
Grade A Golden High-Low
Once again, yer canna make this stuff up 🙂
This morning I finished of the update that will automatically display and update the session Golden Zone and left it running before going to mow the grass etc. for a few hours.
When I came back in I noticed the superb M5 MAB that formed within what was at the time a Golden High-Low. After price broke below the the PW High it retraced as shown with the following confluence :
- 61.8 level of the zone
- The PW High
- M5 MAB
- Other Grid structure not shown
This is yet another great example of how powerful this zone is and when it comes in to play like this some great multiple R trades are on offer.
I’d love to have been at my desk for this one, it was a 100% WTA for sure.
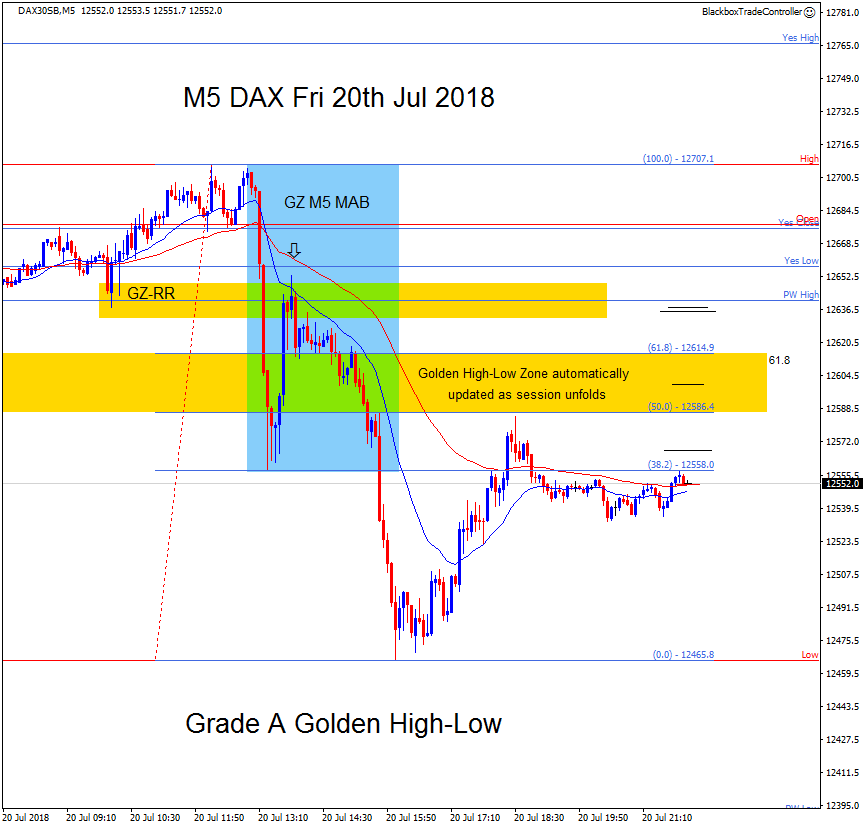
I hope this whets your appetite to use the new feature. It’s based soley on Grid structure removing all subjectivity as point A and B will always be either the session Low or High.
It is therefore a unique FIBCON and something we can all study and learn how to use it to maximum effect 🙂
Below is the same chart only this time the updated Golden High-Low zone is also shown below the earlier one. As either the low or high change so does the zone, the new feature will automatically do this for you.
Based on what I’ve seen so far this adds another great tool to our price action arsenal.
Thursday 19th
07:18
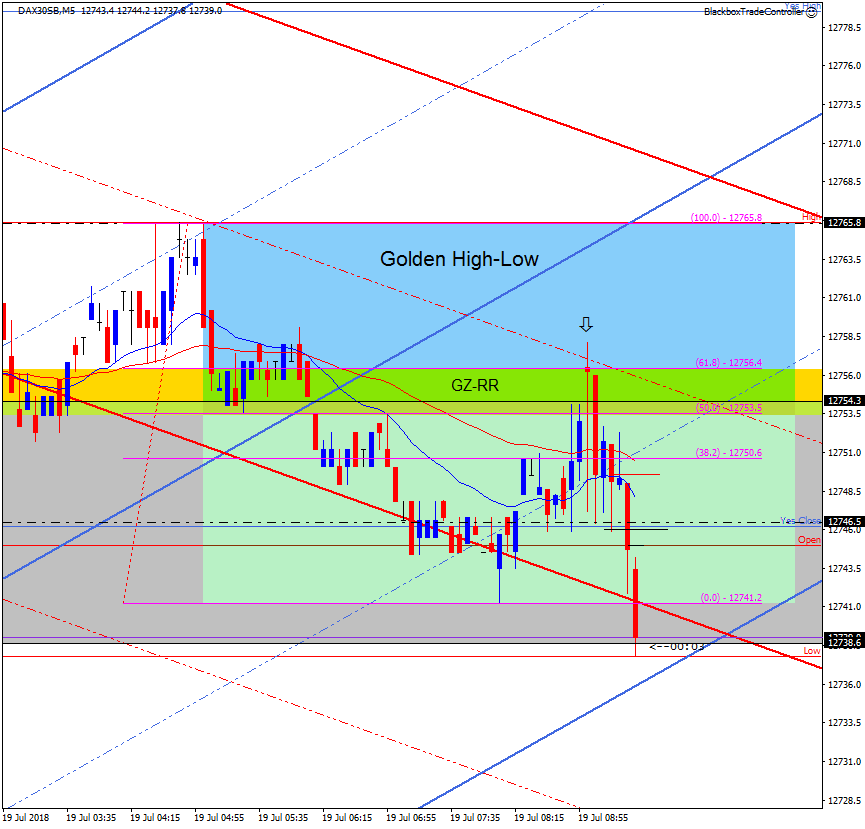
7am Golden High-Low
Wow, yer canna make this stuff up 🙂
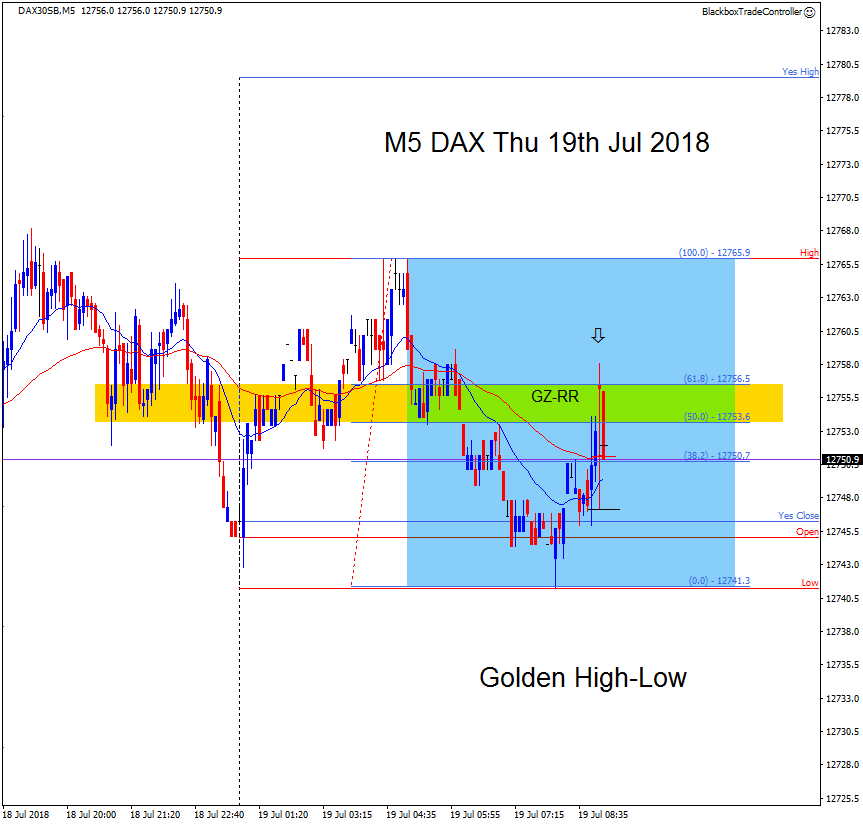
At 7am price gapped up to the 5 min bear mid-channel as shown by the arrow. I then overlaid the FIB tool to see that it was also a very early Golden High-Low where price briefly pushed through the 61.8 level before reversing back down.
I spent yesterday updating the software to automate the detection and display of Golden High-Low’s and Golden Low-High’s after we’ve seen them regularly over the last several days.
Not that we needed any confirmation it was worth doing this but this morning shows how important this zone is and to automate the display of this throughout the session.
I will continue this today so that I can test it live starting tomorrow, I will therefore not be trading today.
Below is the same setup without Grid structure.
As I type price has continued to sell off down to the Daily bull channel and M5 Eq-Zone at 12738.6, how cool to be taking trades based on this unique FIBCON once we build it into our price action read and master it 🙂
Wednesday 18th
10:24
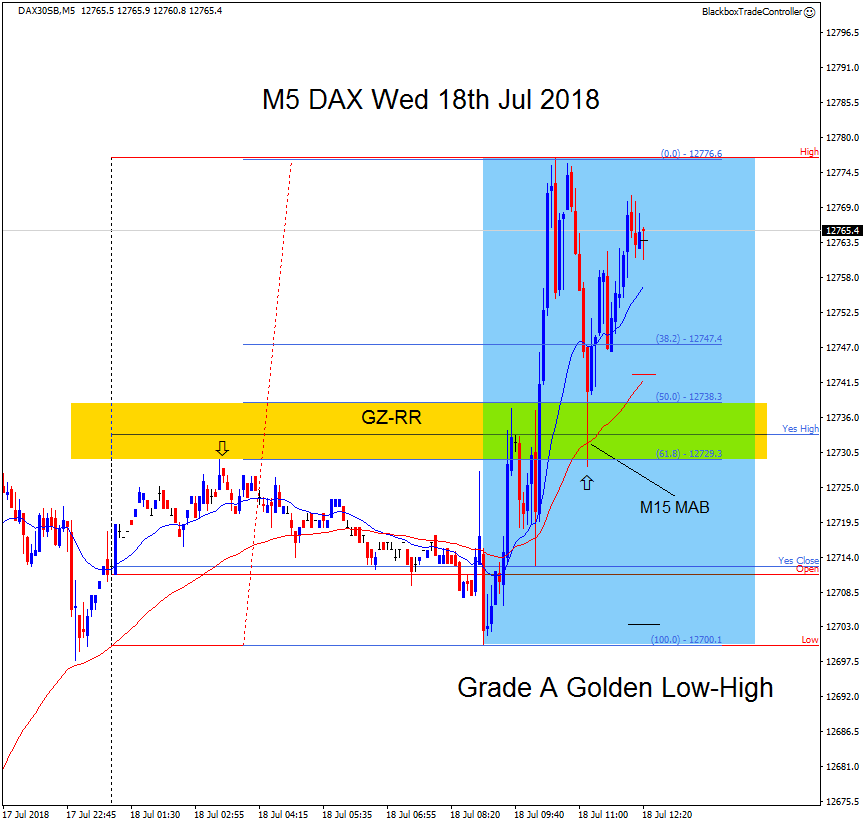
Grade A Golden Low-High
The earlier sell trade was NOT a juicy salmon as mentioned and I should not have taken it. However, it’s prompted me to ask myself what other clues were there in the price action that would have kept me in “Buy Mode” only.
And guess what?
There was a Grade A Golden Low-High and I misssed it!!
I did notice an earlier micro one but again, after the event. I have looked at automating detection of them but had put it on hold until we were really sure it was worth doing.
After today we’ve agreed this is an update that will benefit us all so that’s the plan 🙂
09:34
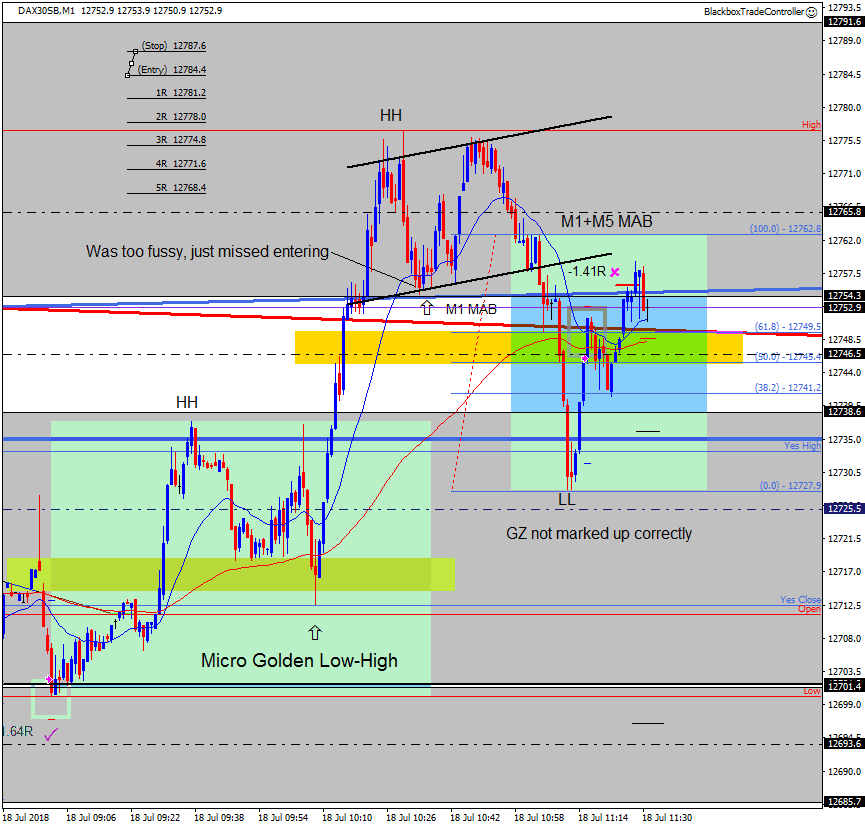
M1+M5 Sell Loser
I just missed taking the M1 MAB after the bull spike above Yes High. I was waiting for a tiny wee bit more of a pullback – too fussy!!
I then entered a sell but this was NOT a juicy salmon, it was a tiddler that I should have left well alone 🙁
My entry was poor so I moved my stop above the bull channel for a -1.41R loss. I didn’t mark up the GZ correctly but it was still a poor trade!
07:45
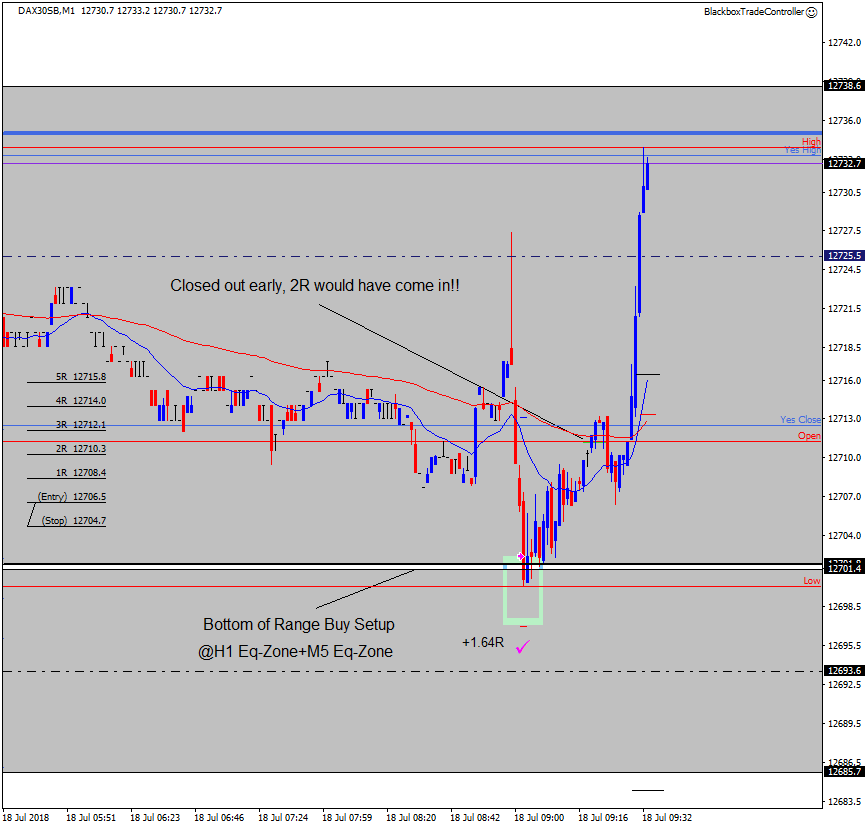
Bottom Of Range Buy Winnner
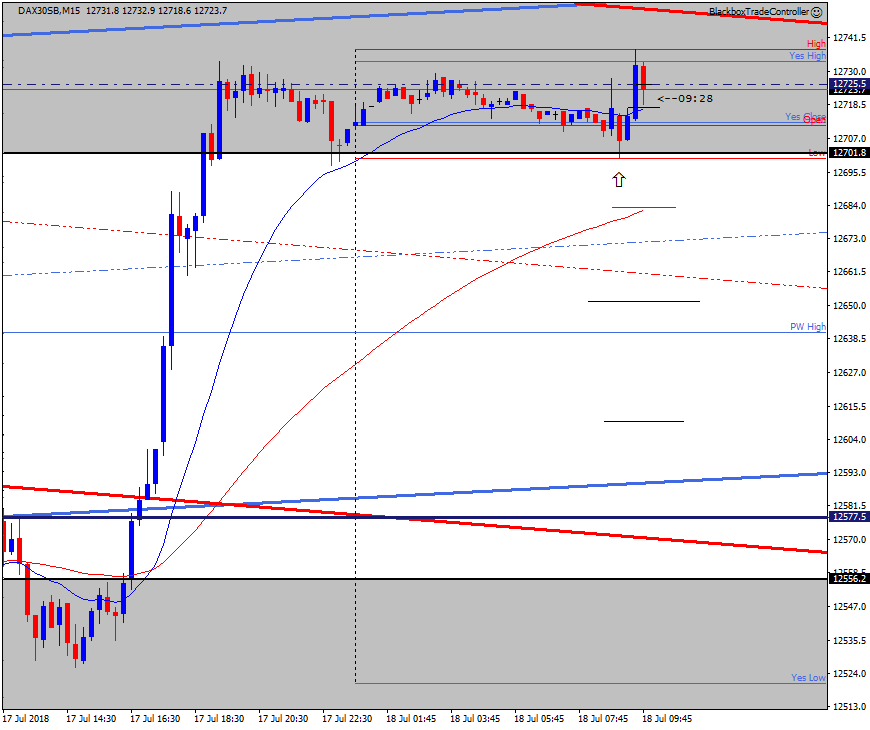
After price eventually broke above the key level of 12577.5 yesterday afternoon/evening I was in buy mode. A clear overnight range had formed with its bottom being the H1 Eq-Zone at 12701.4
Whilst it wasn’t a FIBCON setup as such I decided if price came down to test it I’d buy. That’s what happened so I did 🙂
The trade worked out but I closed out early when it reached the Open+Yes Close+M5 MAB only to it go on and storm on up to Yes High. I was tempted to move my target up to just below Yes High but decided not to, of course that meant it would do exactly that 🙂
Very happy with the trade and a 100% WTA.
Below is the 15 min chart showing the range, the arrow shows where I bought just after the 7am open.
A great example of how the Price Action Grid guides us.
Tuesday 17th
15:09
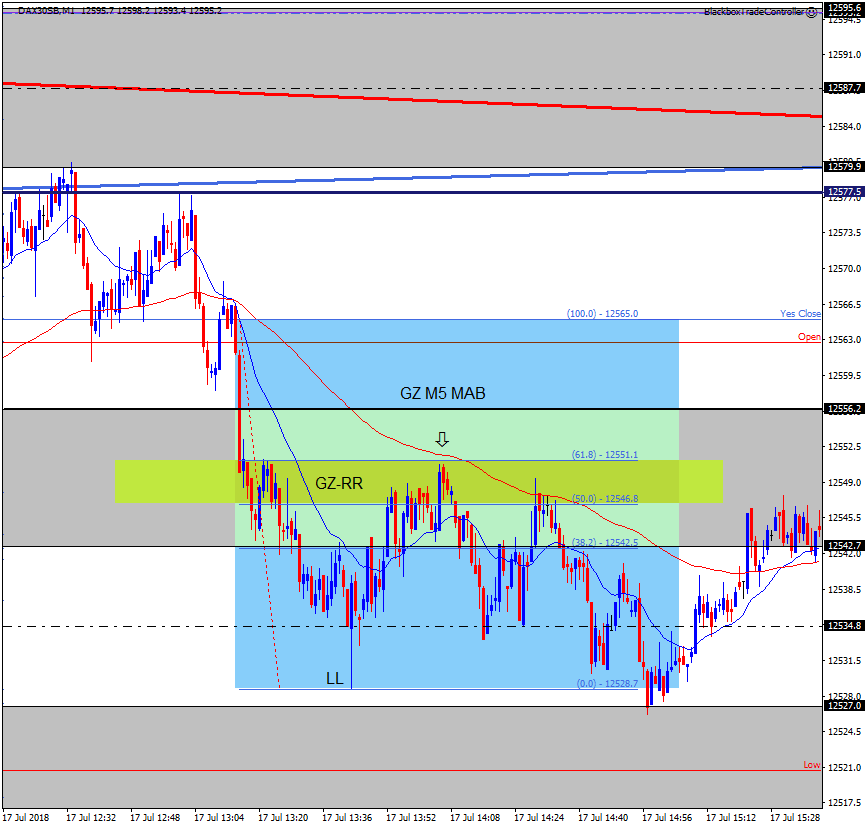
GZ M5 Sell MAB
I had to go and pick up the car along with a few other things at 10:30 after a mad morning session!
I returned home to price has continued to range whilst it struggles to hold above the D1 Eq-Zone boundary at 12577.5, the daily chart shows this clearly.
However, just after noon a juicy salmon came into view in the form of an M5 MAB as shown. A great example of no matter how difficult a session might be to read there is usually at least one really good setup. What we don’t know is when they will come along, hence the need to be Be The Bear when we are a able to watch the price action.
09:02
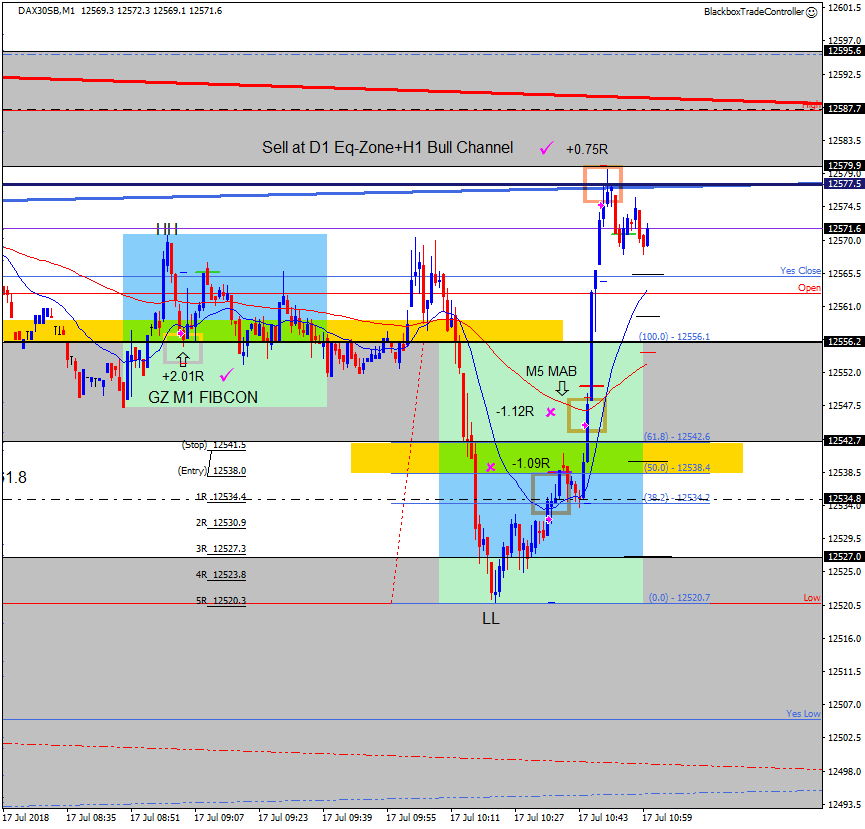
2 losers, 1 winner!!
Wow!!
After nearly entering a sell trade at the break of 12556.2 price went down strongly. I then entered the M1 MAB after finding a GZ Micro Sell Setup. A loser 🙁
I then entered the M5 MAB, a loser 🙁
I then took the sell trade when price reached the Daily Eq-zone at 12577.5 + the H1 Bull Channel. I took a small winner.
I almost didn’t take the M1 MAB but talked myself into thinking price would continue down to Yes Low – Not Today!
I don’t think I would have taken the M1 MAB if I’d not had the early winner but I would have taken the M5 MAB. A real lesson in there’s never a dead cert!
07:15
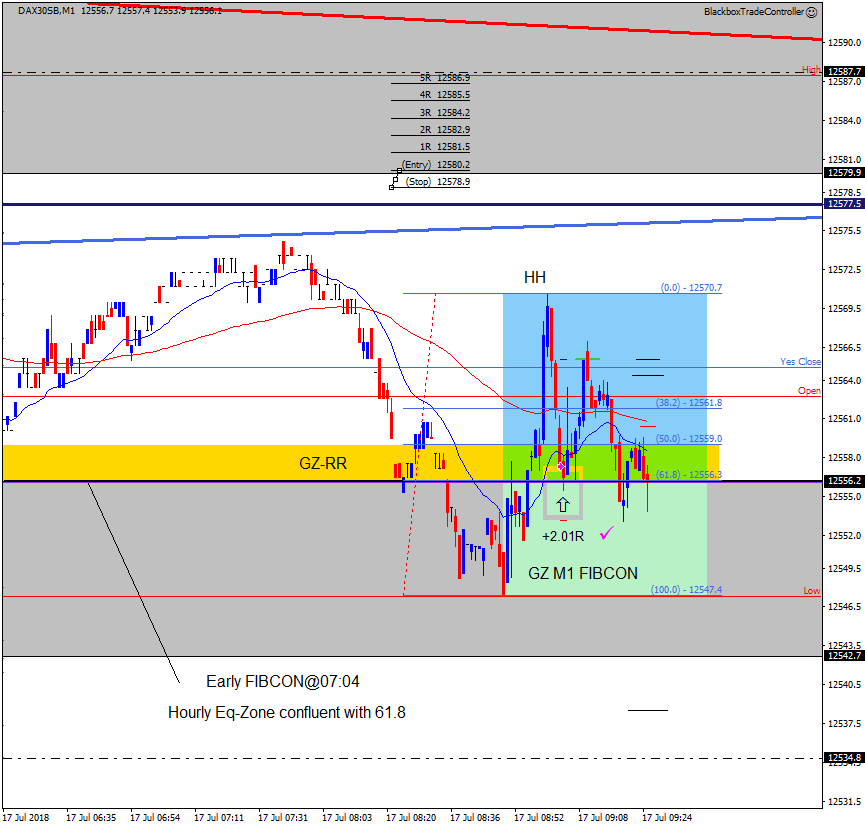
GZ M1 Buy FIBCON Winner
At last!!
On occasions a good setup forms not long after the European open at 7am. I’ve often missed them due to routine or talking myself out of them but today I marked this up and really liked it!
The HH formed at exactly 7am so I put the FIB on with point A at the Low. The 61.8 was PERFECTLY confluent with the hourly Eq-Zone at 12556.2 and when looking-left on the 5 & 15 & hourly charts it was clearly a major level.
I therefore decided if price came down to it I would enter for quick trade since price tends to wait for the London open at 8am before making a major move – if it’s going to.
I had that feeling, “Whatever happens I’d take it again”. It did spike up and down for the first few candles after but then went on to reach my target 🙂
It has since sold off back down below the 61.8 and would probably have triggered my stop so VERY pleased on my entry etc.
Monday 16th
13:26
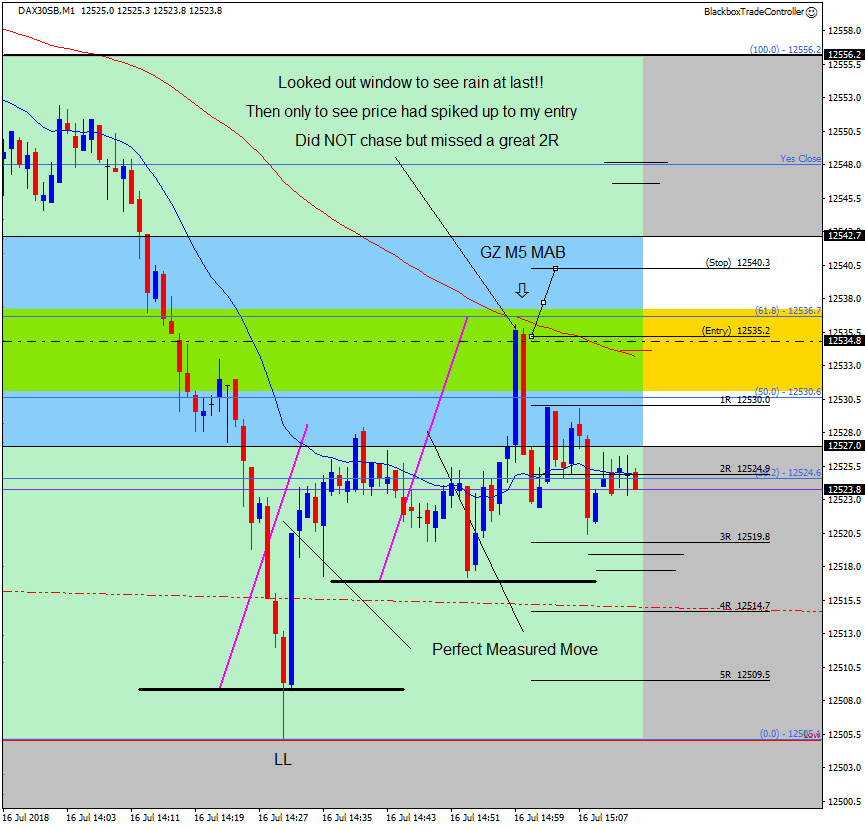
GZ M5 Sell MAB – Just Missed!!!!
Arrghh!!!
I traded briefly this morning before I had to go out and take the car for its MOT, no trades were taken.
When I returned home I took a look at the charts and noticed price had just made a new session low. I passed on the M1 MAB at 12527.0 but spotted a much better value M5 MAB and marked it up as shown.
The Trade Tool was positioned at:
- The 61.8 level
- The M5 MAB
- The 5 min keyzone mid-line
- A project measured move
I waited patiently, however, the sound of rain on the window caused me to take a look. I so enjoyed seeing the rain I spent maybe 20 seconds looking out only to switch back to the chart and see that price had spiked up and was reversing right on my entry point.
I resisted chasing price as the value entry had gone and did not get a second bite at the cherry!! I’m pleased with the anticipation but SO frustrated at missing by seconds.
The good news is Elaine was also anticipating the exact same setup independently and took it resulting in a winner 🙂
So the rain shower cost me a decent 2R winner 🙁 but well done Elaine! It’s also a great example of how we should expect to be spotting the same setups.
Note: The measure move (aka. two legged move) is a common price action feature, that’s why the bssMMove script is in the favorites tab. It’s often a good idea to remove any wicks as shown.

You’re on fire! Well done 🙂
Just took a bit of a shower with the poor quality sell 🙁