Fri 7th Sept

08:30

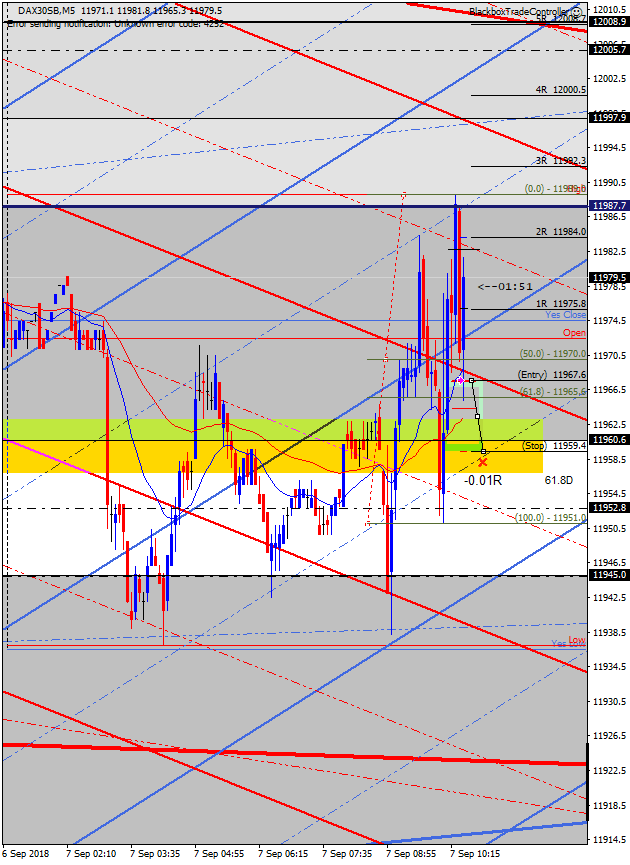
GZ Buy FIBCON

I had it! After hitting a resistance area at the 11987.7 level, price went down quickly to the 61.8 level I marked with anticipation. 

I liked the trade but as it is difficult to measure the strength of a movement, specially after coming off an area of support or resistance, I quickly moved my stop loss to breakeven in case bears took price lower. 

In 30 seconds, I was almost +1R up.

In 1 minute it took me out of the trade for a -0.01R, and half a minute later price was close to my +2R! 

Tue 4th Sept

Today I will create an unorthodox post. 

I was hesitating to post today’s trades as I am definitely not proud of them. But it wouldn’t be honest to post only the good side of my trading, showing only perfect confluence and timing as if we were robots taking only great trades.

So far, I am profitable for the day but I am not happy about my performance. If your chart ever looks like the ones below, you are at least, not trading the edge taught by the guys from Blackbox. 

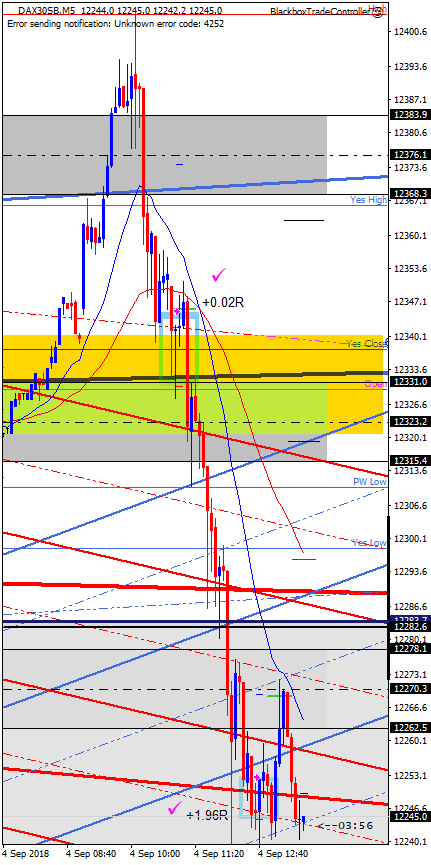
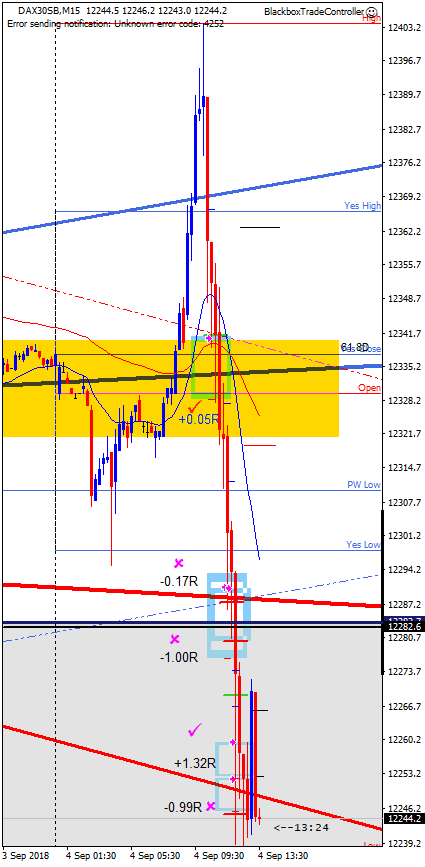
It started well, with me managing risk in the first two trades, but I was blinsided by the initial move up at the beginning of the session, not noticing that it was an agressive trend that would last at least 4 hours. I was in buy mode the whole session, missing good opportunities to sell. Please see below 7 trades, split between the 5 and 15 minute charts:     


08:55

10:40

SUPCON – H1 Bear Mid Channel

SUPCON – H1 Bear Channel

08:30

Multiple trades

What you saw above is a trader ignoring a clear trend in the market.

I had 7 buy trades in a market that was and (as of 11:52AM) still is plummetting.

I am +1.19R yet I know that it is not the way that will take me to consistent profit. Lesson learnt! 


Mon 3rd Sept

09:08

H1 Sell MAB

I had to go to the City for an hour but before leaving I spent some time trying to identify possible support/resistance areas that could give me some profit.

When I left price was hanging around the Daily Bull Channel(as I write it is still doing so). However, I left my trade tool in a place where I would take a trade if price got there.

When I returned, the screen shot above shows exactly how I found it. Price went right up, got to the Mid H1Bear Channel and, helped by the H1 moving average, had a fast retracement to the Daily Bull Channel. A quick +2R or more had I been at home at that time.

Anyway, happy to have identified that trade in advance, that’s definitely the way forward! 

Fri 31st August

08:40

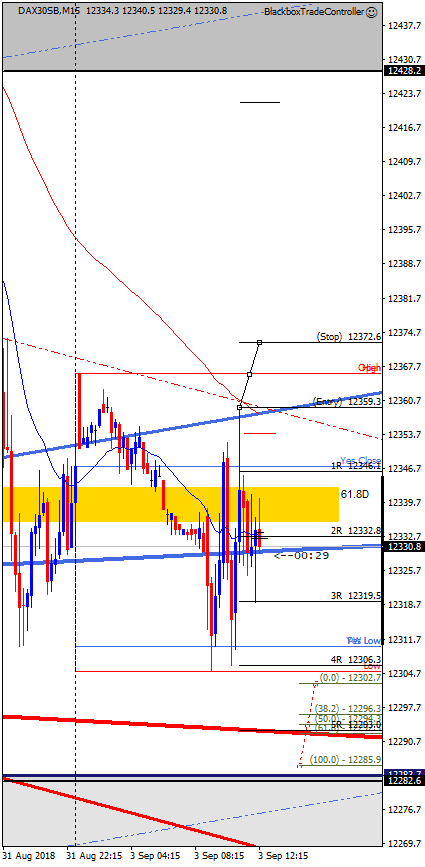
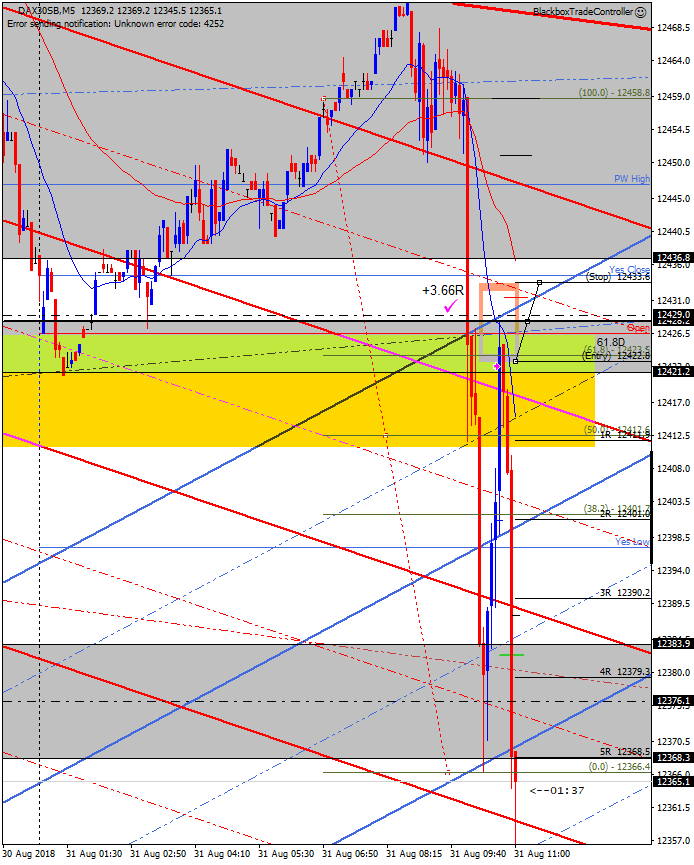
GZ M5 Sell FIBCON +3.66R

Yes! I’ve waited long for a trade like this one. For months I took poor value trades, which caused me not to trust in good setups!

Since last week I’ve been taking resonably good trades only to close them too early for too little profit.

Not today, hopefully not anymore. 

Price retracted to the bottom of a very significant level over the last 2 months, that is, the hourly equidistant structure at 12428.2

I prepared in advance and entered the trade on the 61.8 level of the Fibonacci retracement tool. It proved a good call! 

Something to improve? Taking into account the concept of measured move to maximise profit, given that price almost replicated the previous downtrend (called by Blackbox the A-B leg). 

Anyway,  nothing to complaint about, a good way to finish the week!

8:15

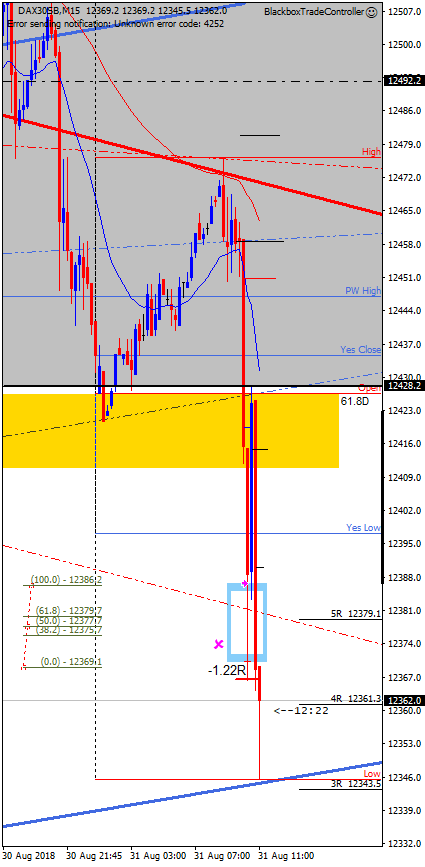
SUPCON -1.22R

The day of the “slippery salmon”? That’s what I thought on my first trade… I waited for price to brake the H1 Bear mid channel, kept being patient until it went over the same line, and entered the trade just to see how a last push downwards took me off the trade before retracing above my 2R level.   

Wed 29 Aug

10:20

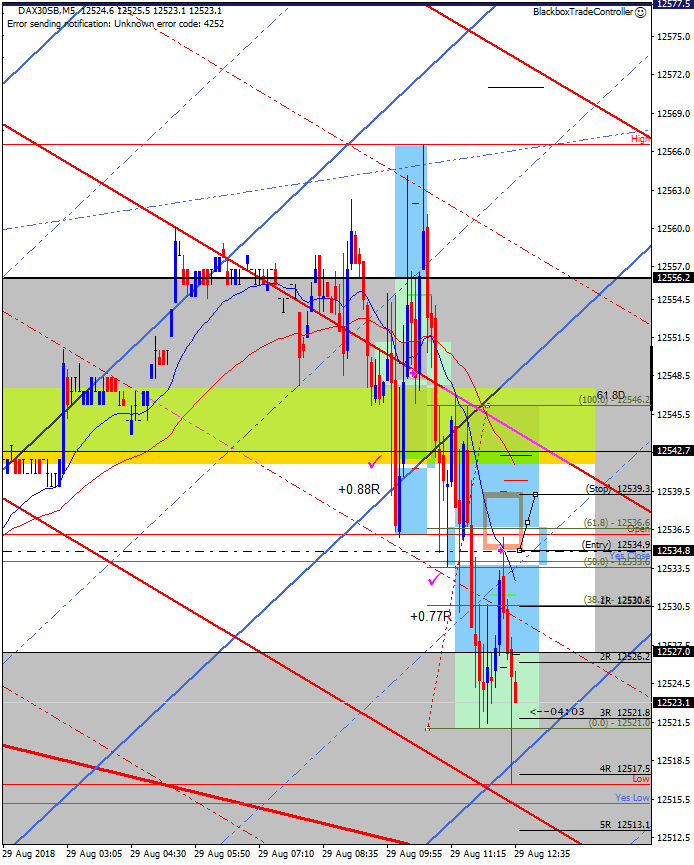
GZ M5 Sell MAB

Small profits for the kind of trades I took today!

Good timing, a generous stop loss and still both could have been +2R. But instead of focusing in the money I left on the table, I am happy that I chose good trades, as I know that as long as I keep trading this kind of setups, the long term probability of being consistently profitable is high! 

Fri 24th Aug

09:00

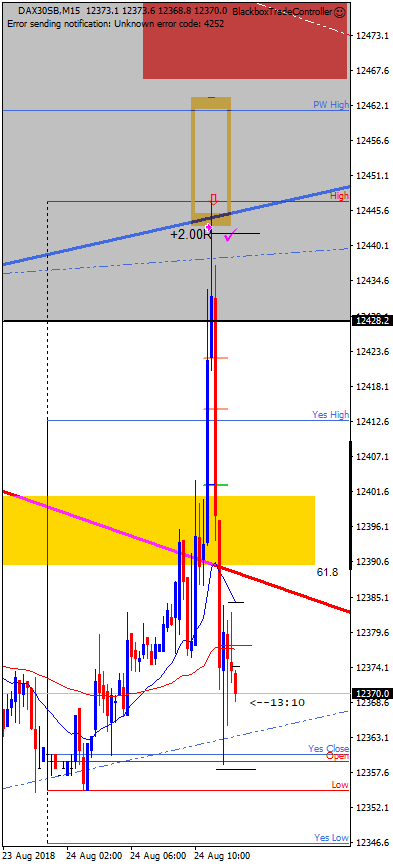
D1 MAB + RESCON – +2R Winner

Nice RESCON right at the Daily MA supported by as well by the grid!

After looking at Mr. Phi’s post (https://blackboxsoftwaresolutions.com/fri-24th-aug/) and analysing the charts, I marked the zone whit an arrow pointing down and waited till it got there. 

I was a bit conservative with the stop loss, looking for tangible resistance in case it kept going up, but a +2R is a great winner anyway!

Thu 23rd Aug

10:20

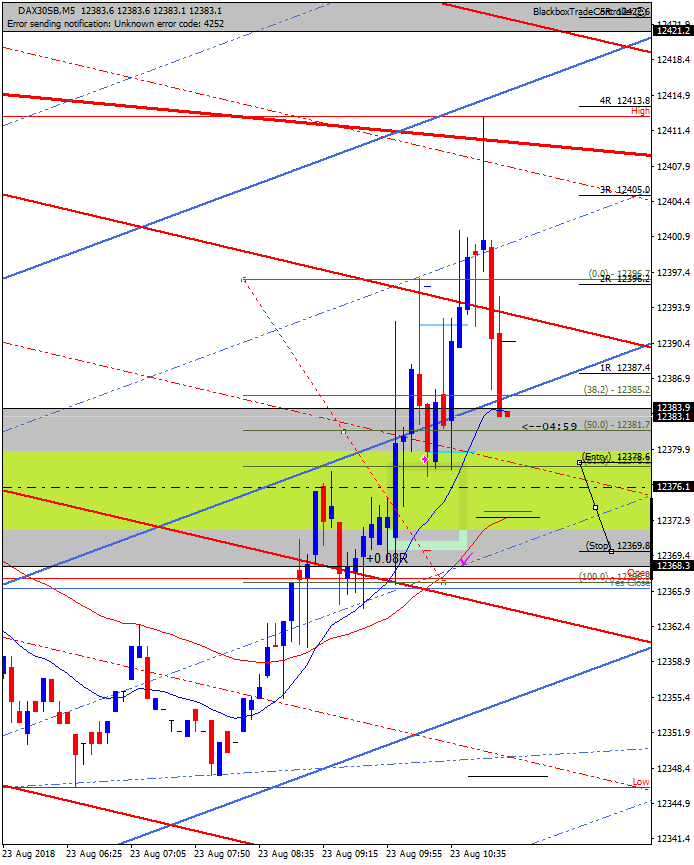
GZ M5 FIBCON

M5 Chart

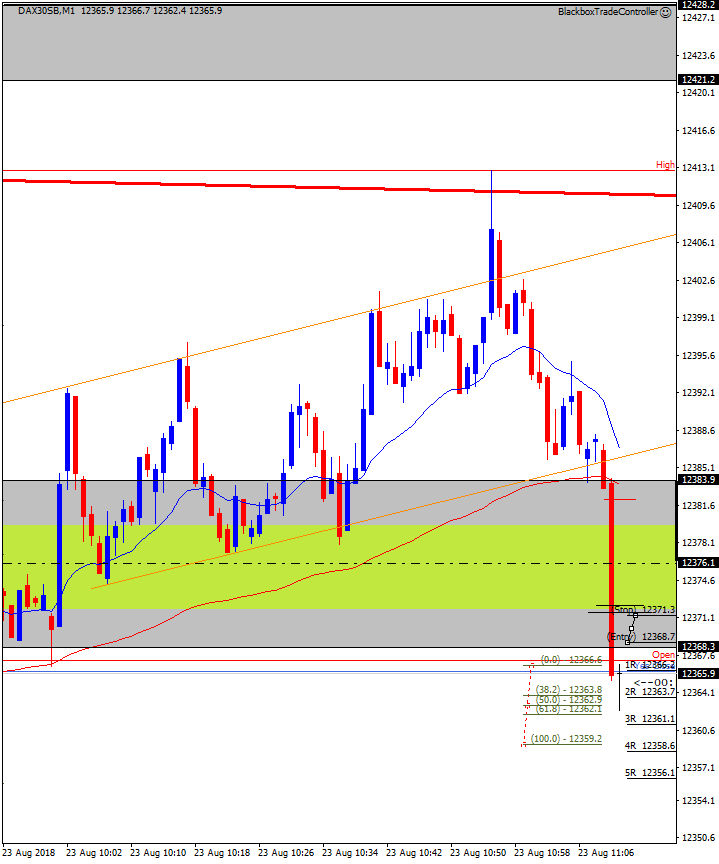
M1 Chart

I guess that if you click on the charts and take a look at it, you might feel as upset as I did! 

Marked a good M5 FIBCON right after the volatility of the London open vanished, waited for it and pressed Ctrl+E right there, on the edge of a reversal that happened after a short hesitation.

Having the M1 MAB above my entry level wasn’t that exciting, but I decided to let it run at least until it goes above my 1R level. Locked in profit after touching +1.5R (as there was a RR zone looking to the left in the M5 chart), raised my take profit level to the H1 bear channel boundary and left it alone. 

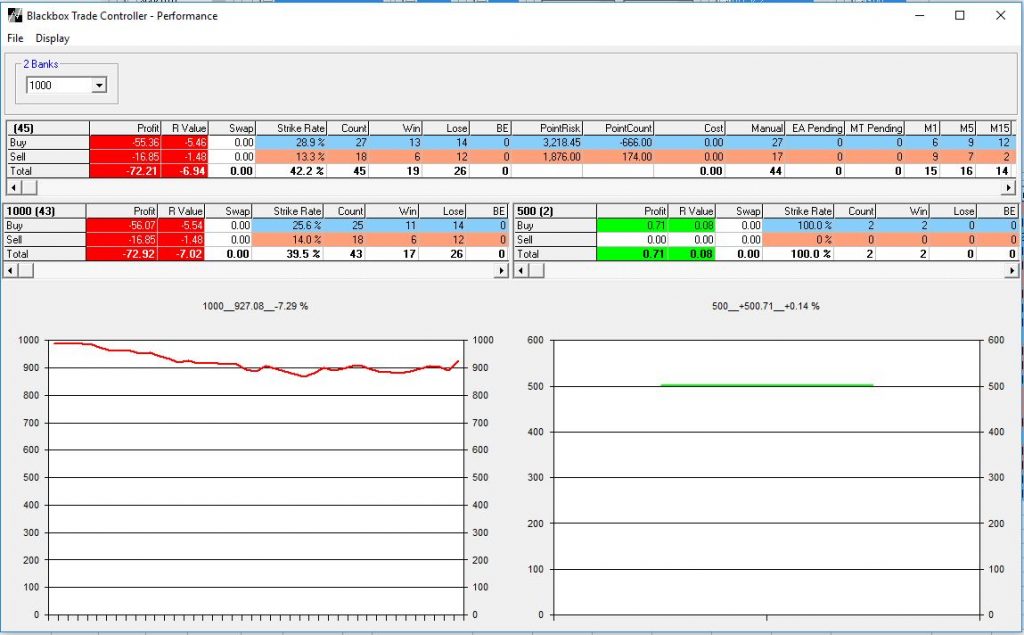
The rest is history. Retraced to my entry level, left me out of the trade and went non-stop to my target. A +3.5R ended up being a +0.08R trade.

Should I have left my stop loss at the original level (-1R)? Did I do right locking profit in order not to lose money in case the trend changed? I don’t know. 

I think the answer could have been: take profit at +1.5R where the RR zone was, see what happens and if it comes back down and you like it, enter another trade. Worst case scenario, you end up +0.5R. In this case, I would have ended securing +4R.

 

June 2018

<< May 2018

June 2018

SMTWTFS
     12
3356789
10111213141516
17181920212223
24252627282930

Wednesday 27th

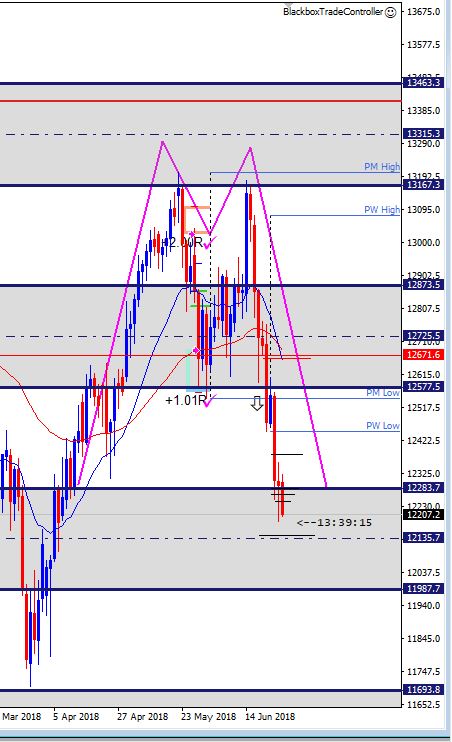
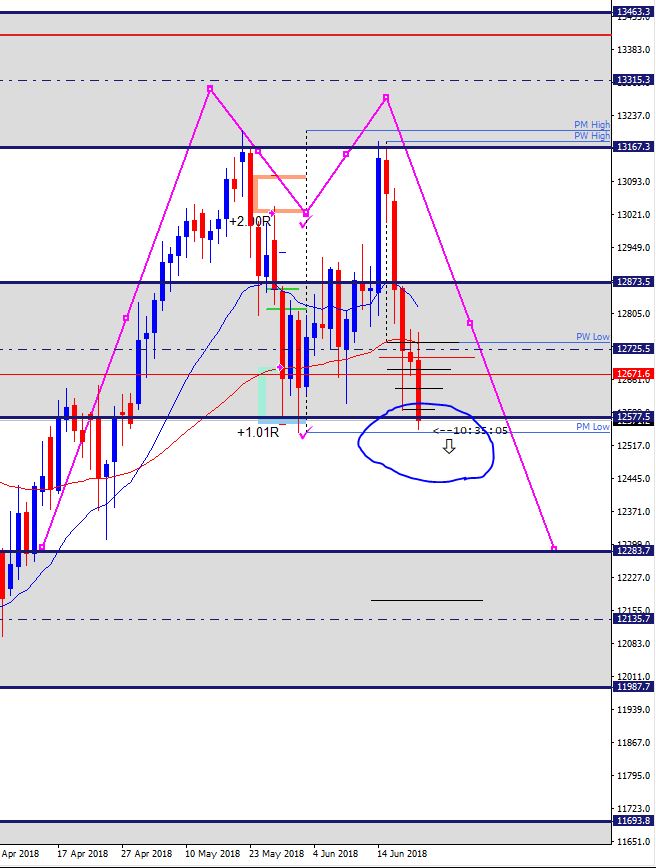
Double Top Clearly in Play

Still amazed by the speed of the movement, the Double Top was clearly in play!

Price broke the PM Low, retraced the day after and retook the bearish trend on Monday with a very aggresive move.

The question now is: will it go now towards the PW Low to then resume its way dow to end of March levels or is the downtrend ending?

I’d like to hear your views on which signals should we look for in order to make the most of such a nice price action!

Thursday 21st

Trade Ideas

It looks like the market likes to play with fire.

Faster than expected at the beginning of the week and helped by concerns over a trade war between US and China, price is now playing around the Previous Month Low (PM Low).

It might not be today, and it might not happen at all, but a Double Top could have formed days ago at the 13167.3 level (base of a daily equidistant zone), and if prices manage to close below the PM Low level, further weakness might be seen in the market, at least until reaching the 12283.7 area, where price retook a bullish trend near the end of April.

I would like to see a rebound today in order to consolidate price and then a nice way down to end of April levels. 

Friday 15th

Quick Update

This might have been the move. The trend upwards is looking solid, we should see how price interacts with the 13103.4 level.

The World Cup is calling me. It was a very profitable day for me as I caught the whole trend down, so I will call it a day!

Have a good weekend.

Alex

Epic FIBCON at the 4 Hour EMA?

If it manages to break the 13103.4, fasten your seatbelts because I expect it to go all the way down to the 12975.4 level, that is, to the bottom of the hourly equidistant structure.

I expect a move upwards before going down to break the resistance at the 13103.4 level, possibly to 15ema or Yes Close/Open levels!

Happy trading 🙂

Alex

Thursday 14th

Possible FIBCON with Support at 12829.7 Level