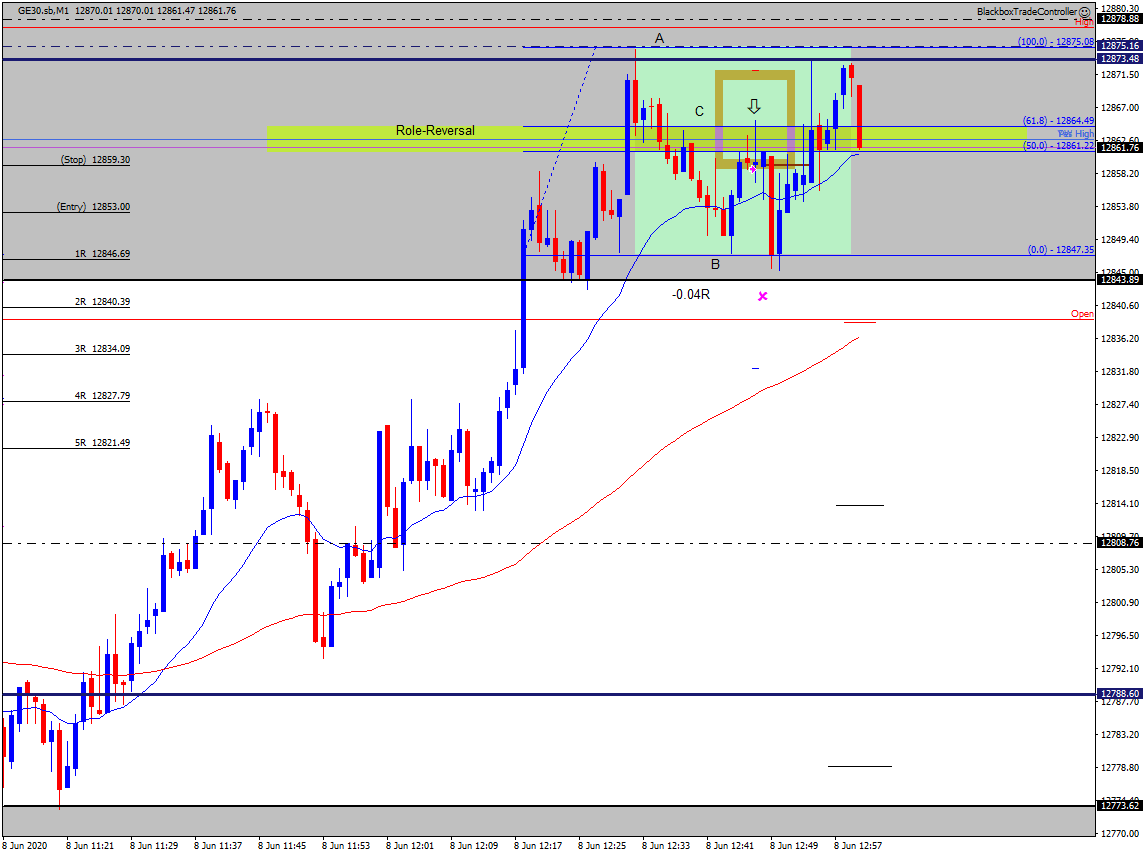
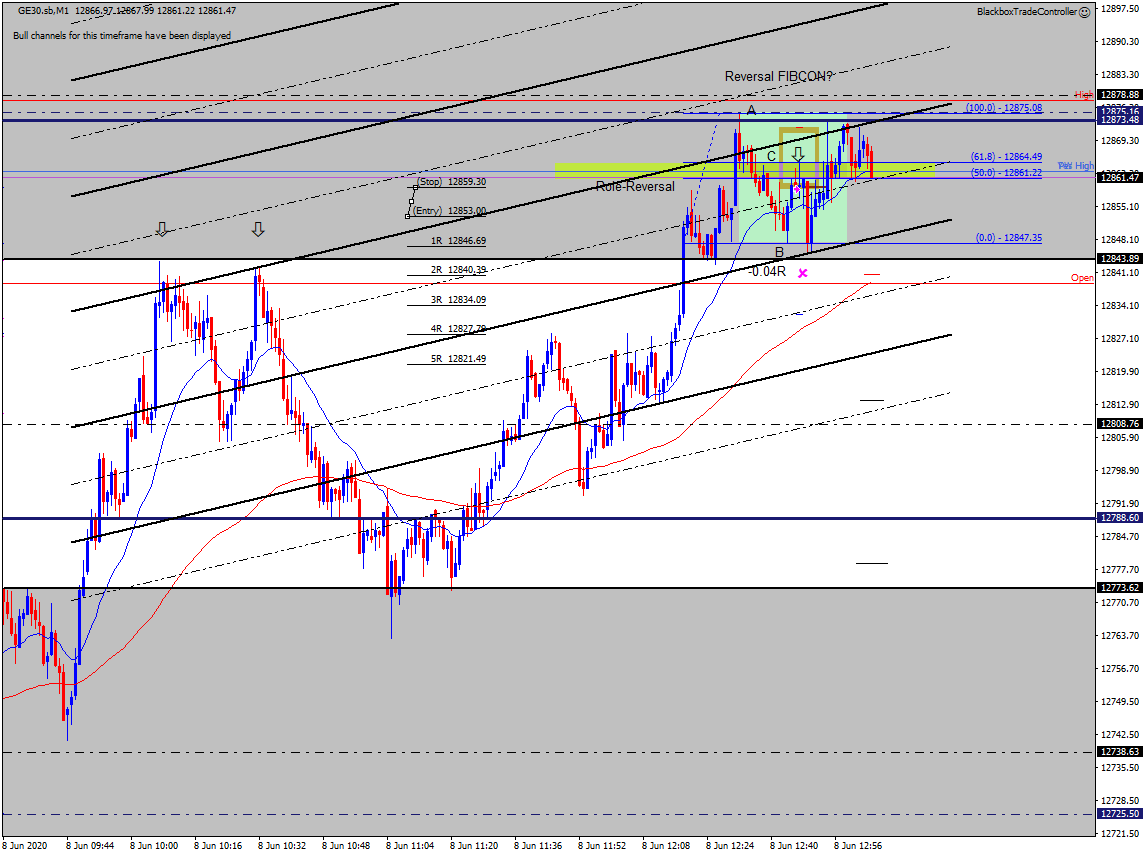
Welcome to the daily DAX commentary where we share with members our unique take on Price Action as the session unfolds. We comment on trade setups that conform to our Trading Edge and how we use the hybrid Blackbox Trade Controller for MT4.
Use the comments section below to post questions and read what others are saying.
Remember to:
- Follow your Trading Plan.
- Practice Visualization Techniques.
- Review and journal your trades at the end of each session.
- And above all else Be The Bear….

12:34
Using Alerts To Take A Break
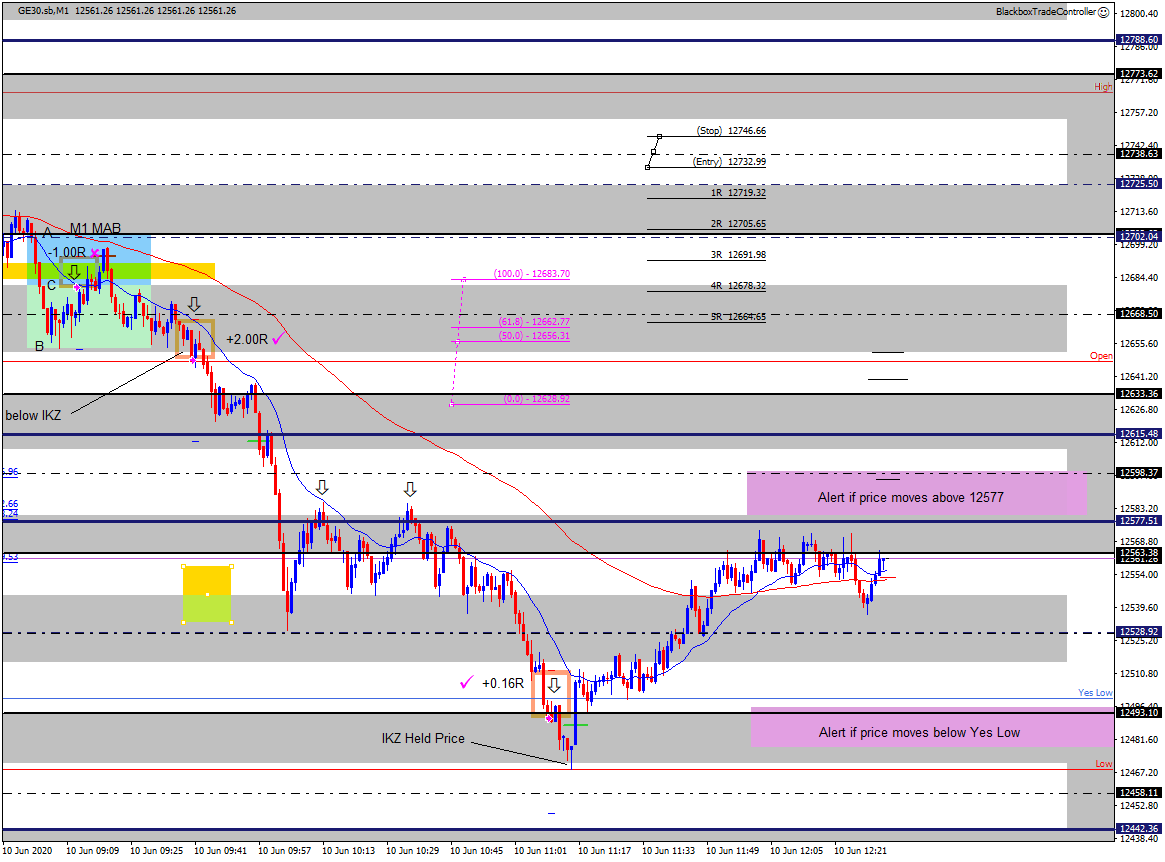
This is an example of how to use alerts. I’m only interested if price breaks above 12577 or below Yes Low.
I can minimize my charts, close my eyes, and chill rather than have to keep watching the charts.
As I’m typing the alert if price moved above 12577 has triggered.
11:28
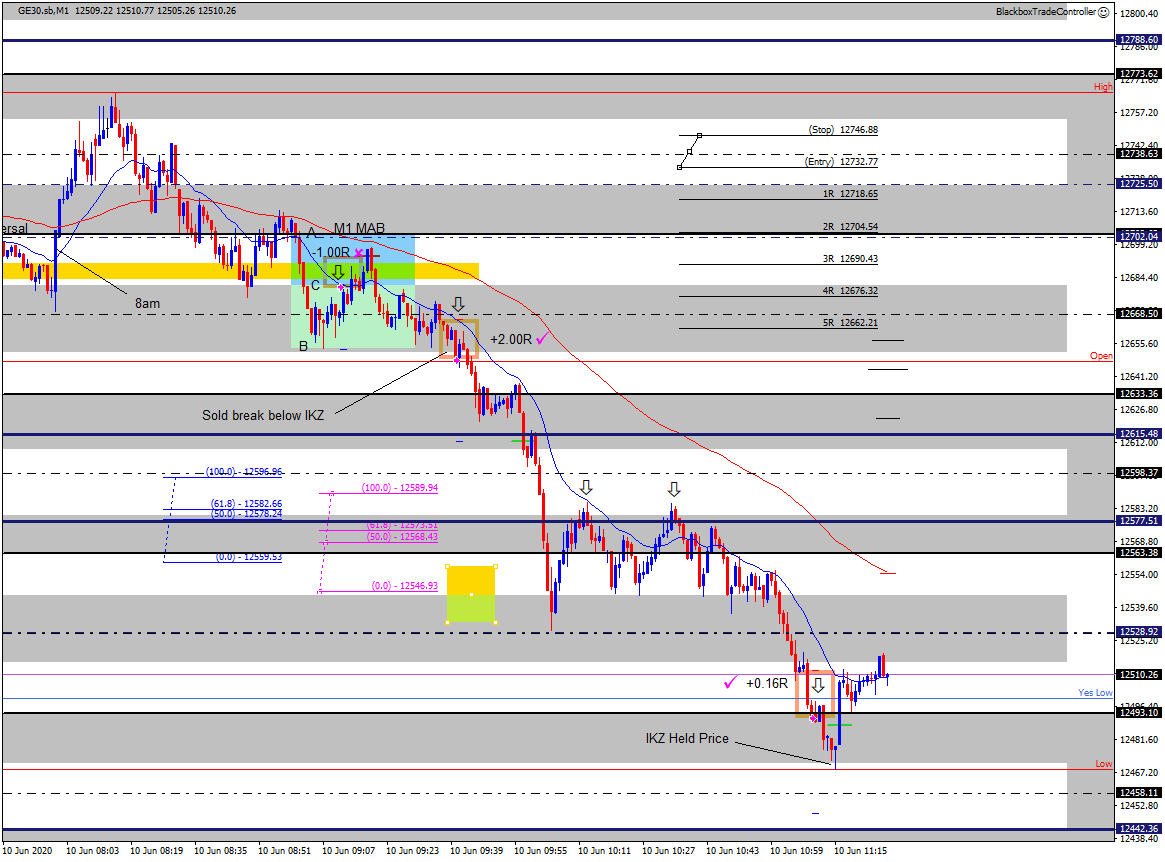
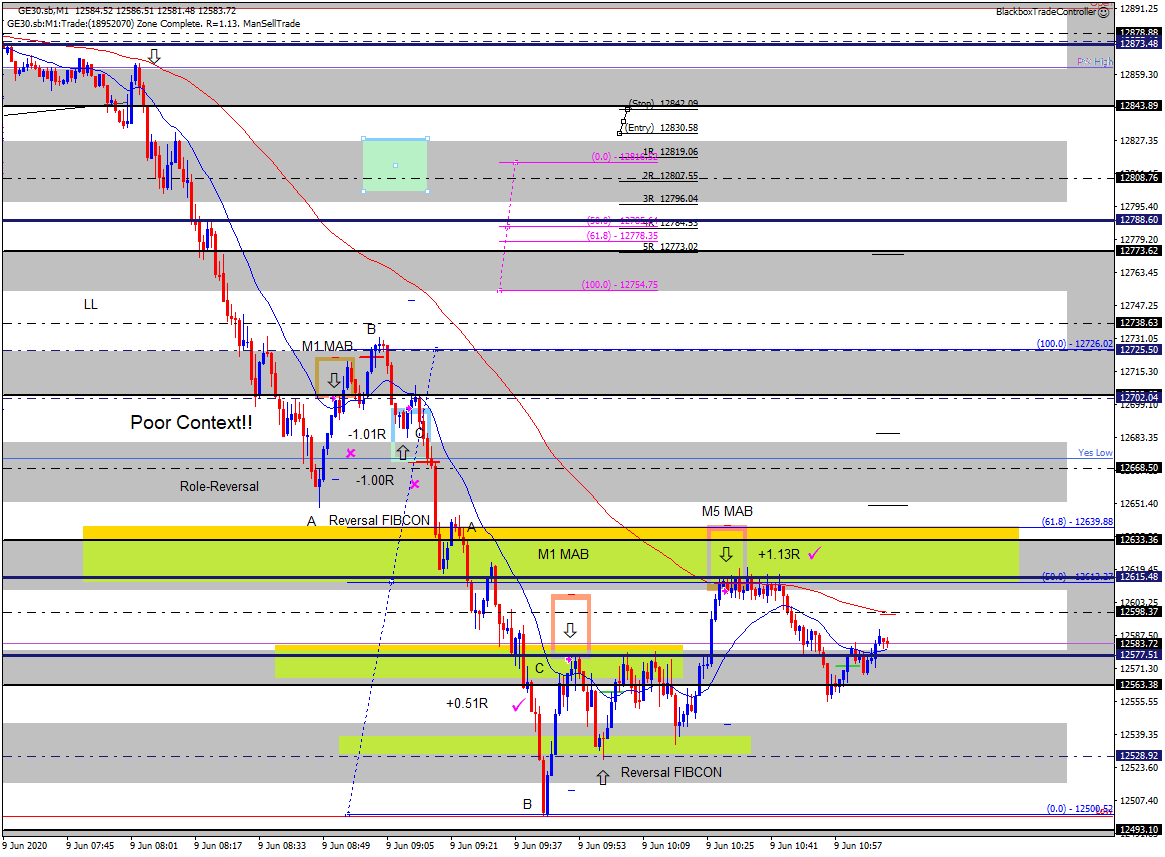
BE Sell, +0.16R
I passed on the M1 sell MAB at the pullback to the 12577 level, I was trying to get a perfect entry after my earlier M1 Sell loser!
However, when price broke below the midline@12528 I was ready to enter on a pullback to it, that did not happen.
I then sold on the break below Yes Low – this was aggressive – and trailed stop to BE asap due to the IKZ just below. These zones are powerful and it proved a good call 🙂
Take a look at the IKZs I’ve overlaid, they’re the ones that don’t extend completely to the right. Note how price touches them perfectly at times, see the two down arrows at 12577, and how they sent price down to the top of the one below.
They are easy to turn on or off and today have proved a good guide as to when price will reverse. The important thing is we don’t clutter the chart with too much information but if the horizontal structure is accurate and in play then they can be used accordingly.
10:25
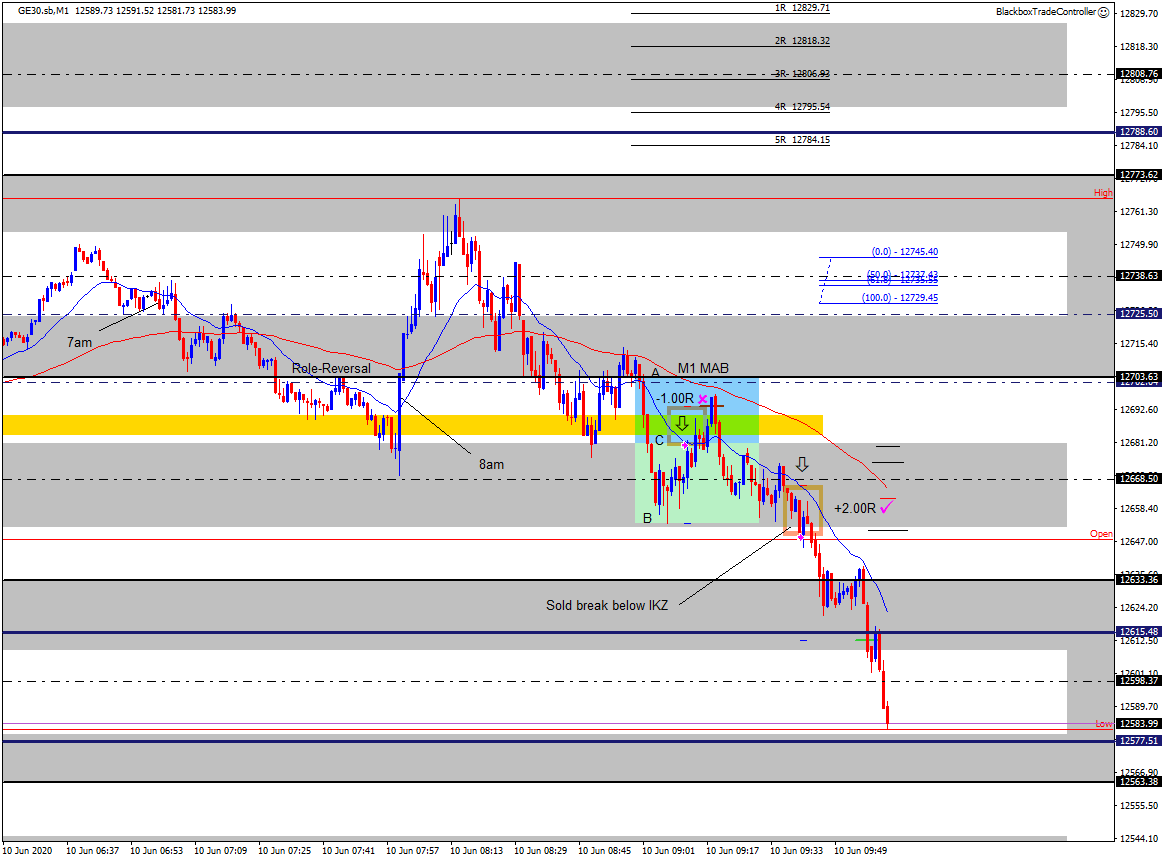
Sell Winner, +2.00R
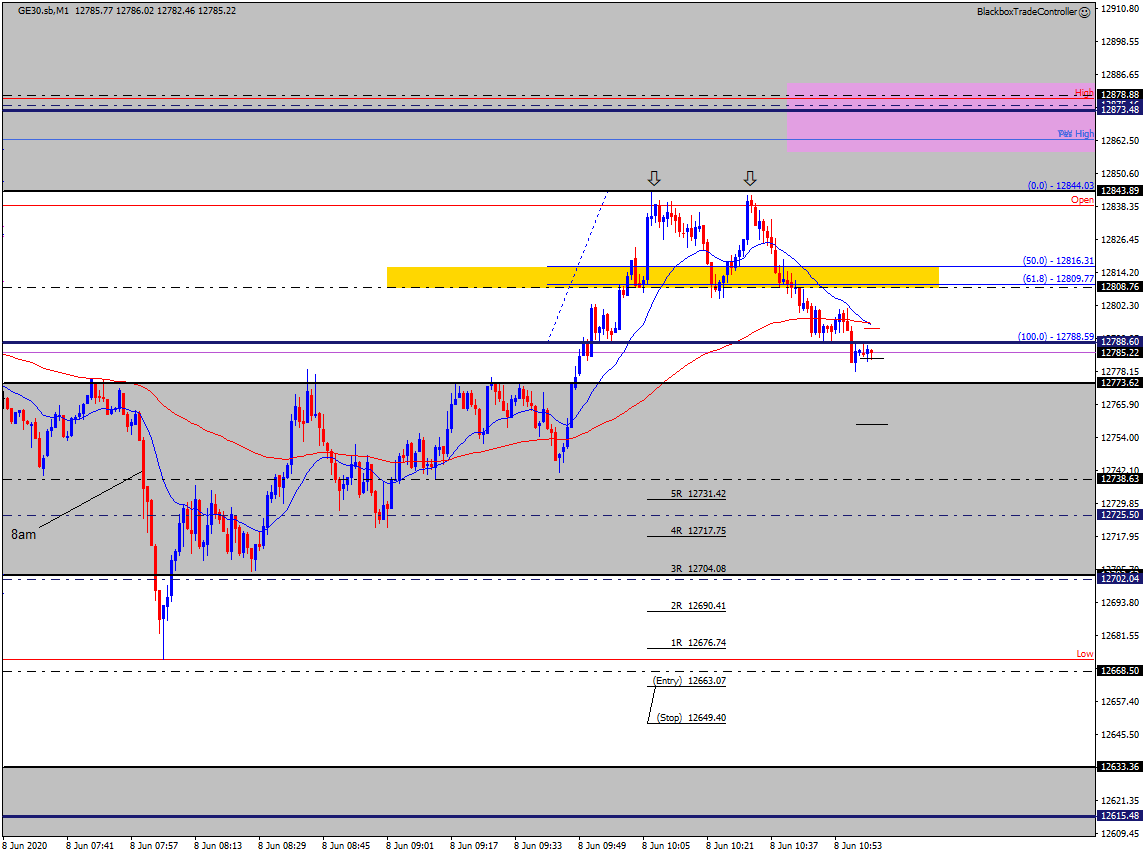
This was not a textbook A-B-C sell setup but when price looked like it was going to break below the IKZ just above the Open I entered a sell trade.
This was an instinctive trade as I was in sell mode once price had broken below the 12702 level that I mentioned at the start of the blog.
Note: The Intraday KeyZone (IKZ) is part of some additional horizontal structure that sits within the M30 EQZs. I will do a video on this over the next few days.
Just like channels, it can easily be turned on or off depending on whether it’s helpful.
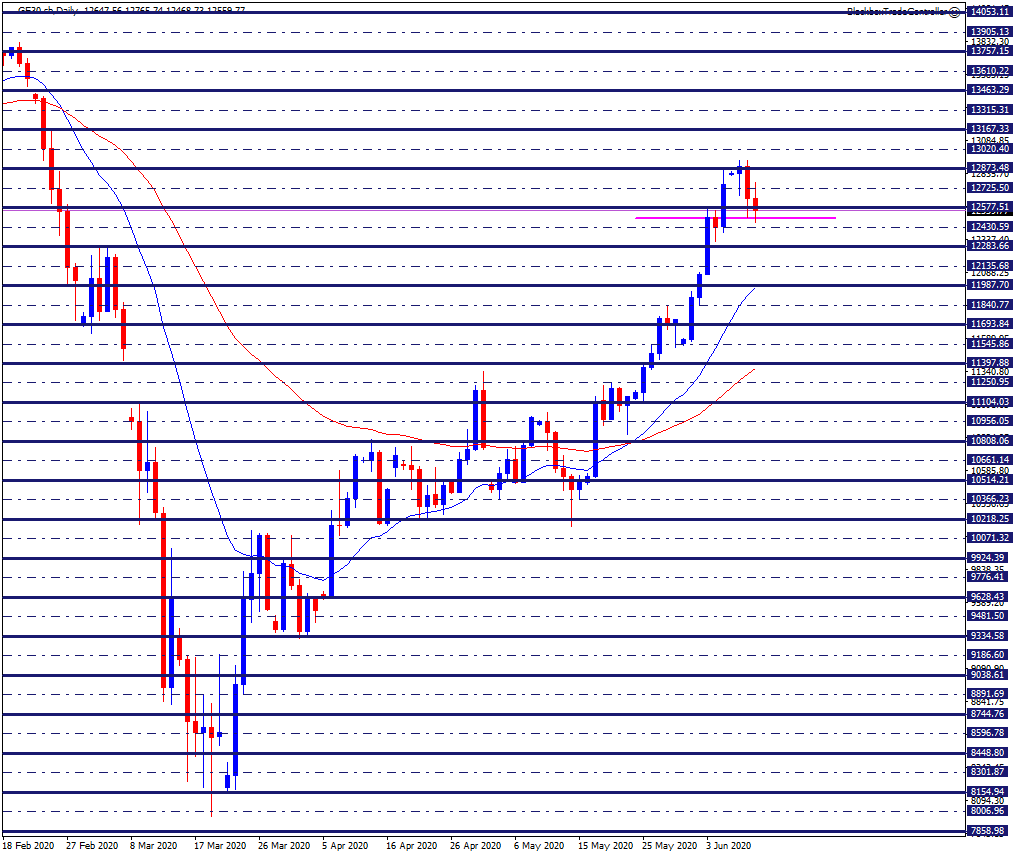
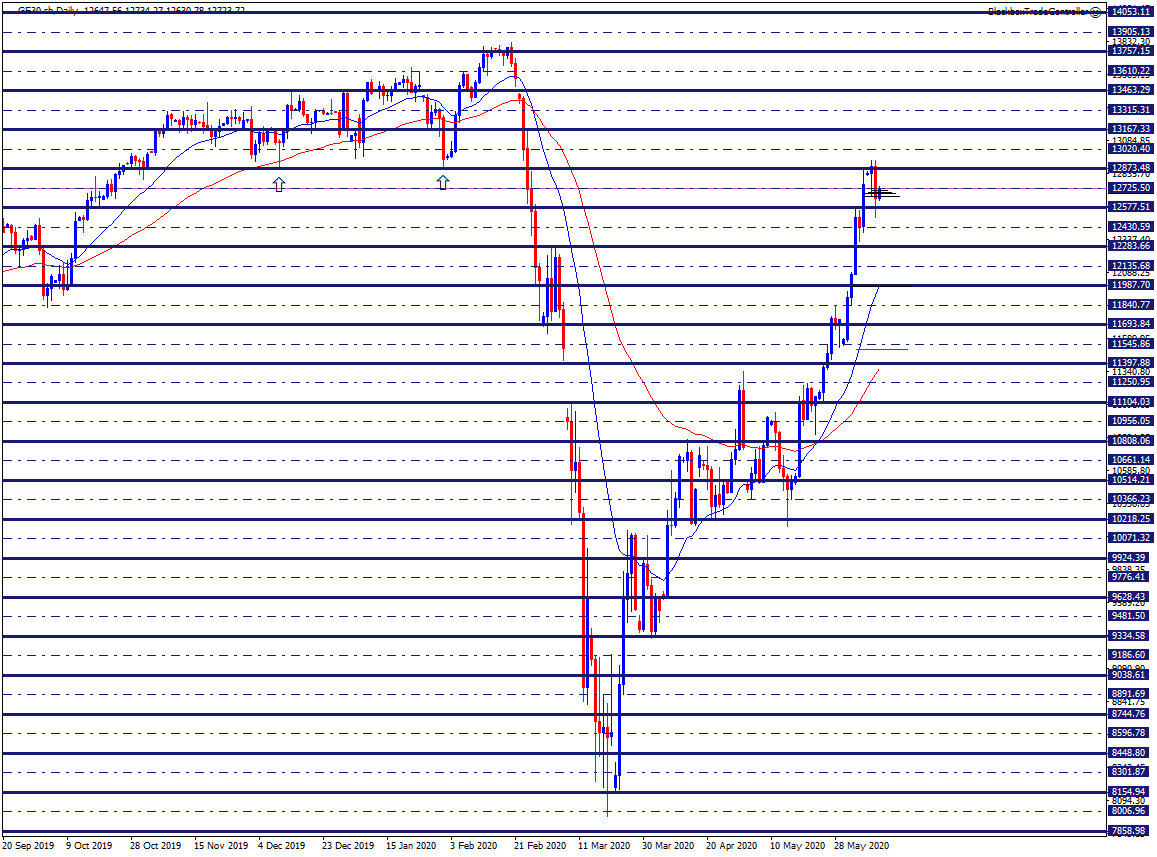
Price is currently at the Daily level of 12577
07:13
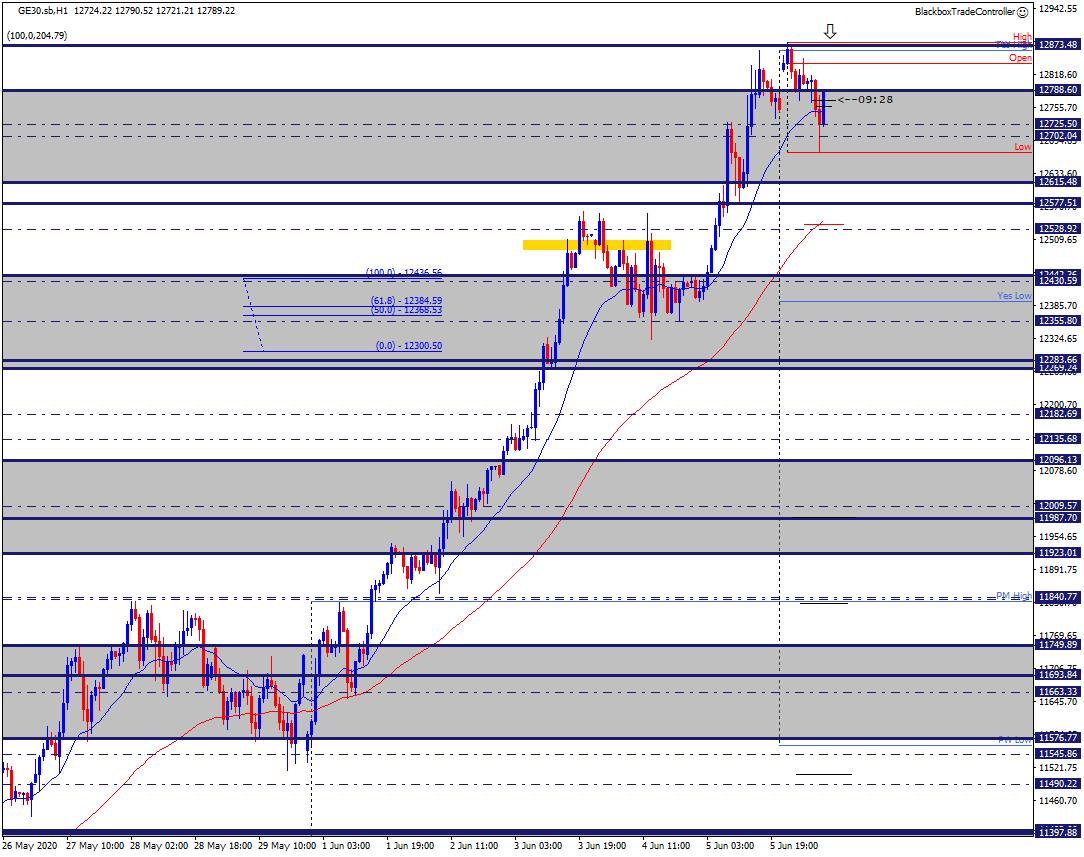
Golden Zone on the Hourly Chart
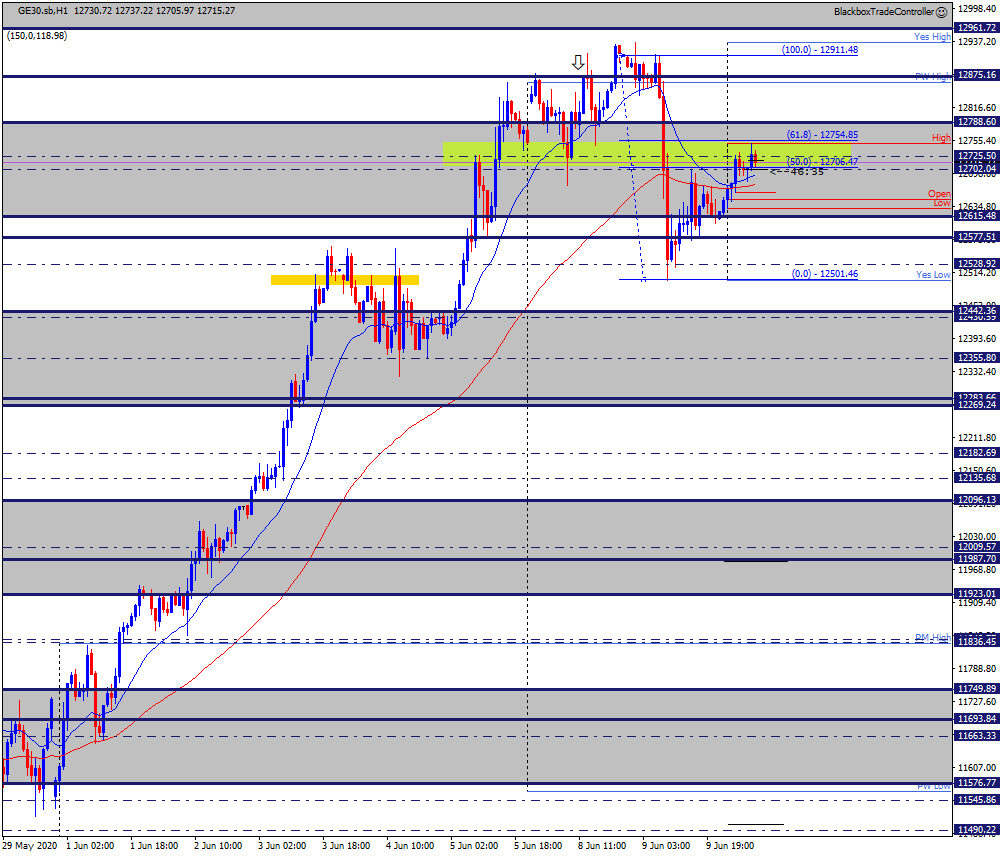
There’s a GZ on the H1 chart between 12706 – 12754, it’s confluent with two midlines and clear Role-Reversal when you look-left.
If price tries to make new highs above the 61.8 level and fails then we might see a move down to the Open and H4 EQZ@12615?
A clear break below the H4 midline@12702 could offer a sell setup?

