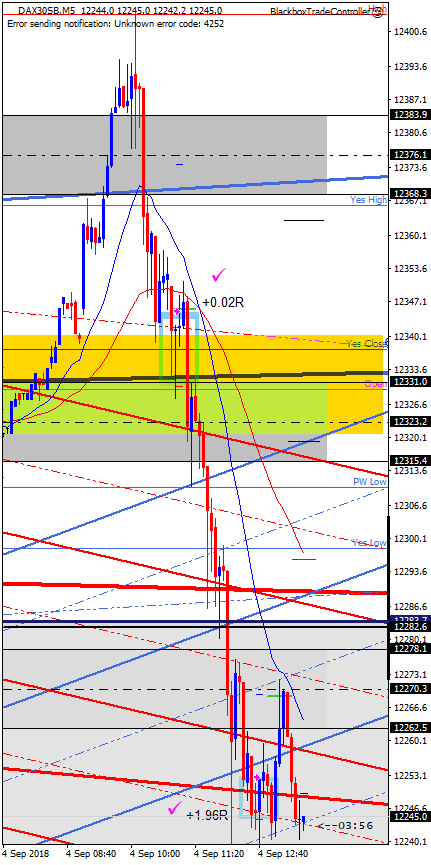
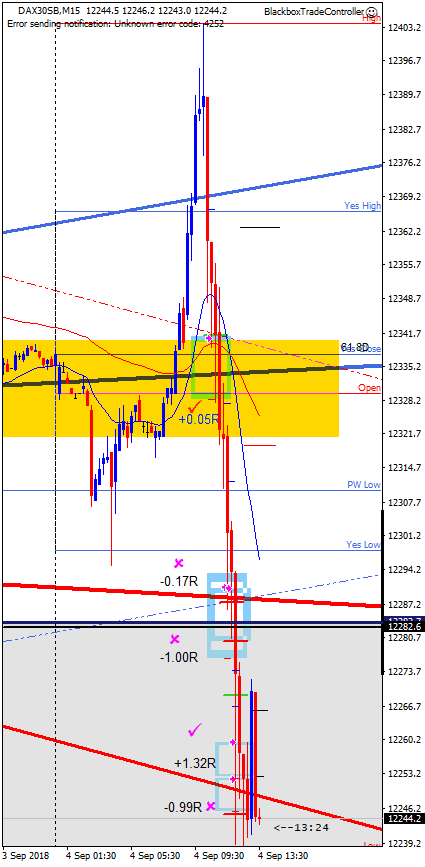
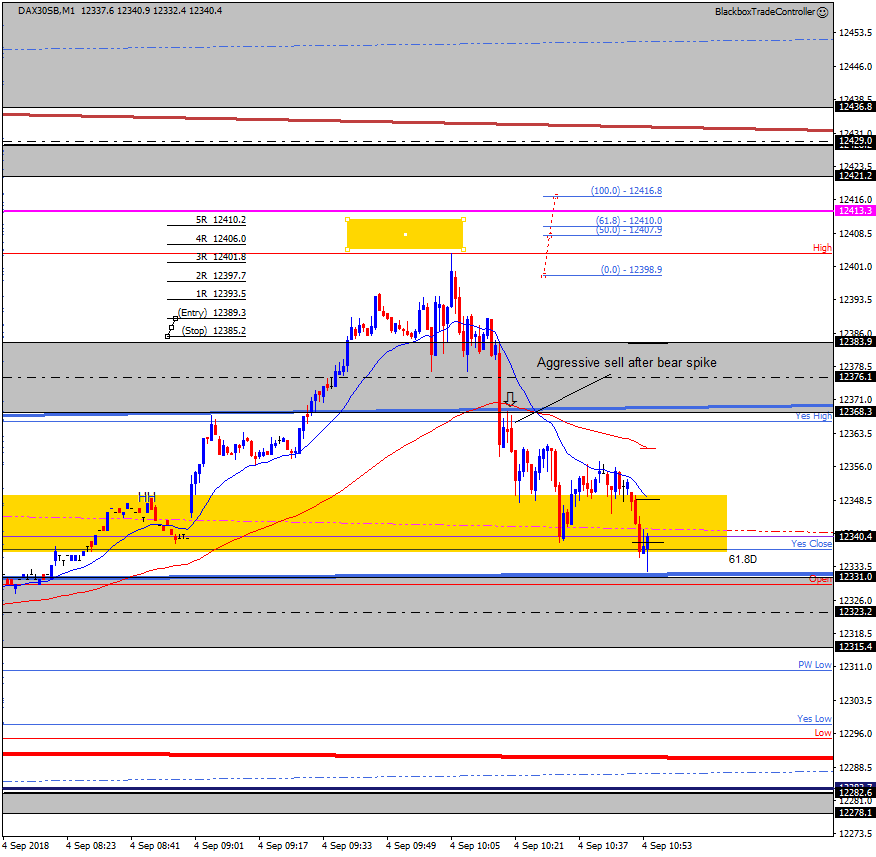
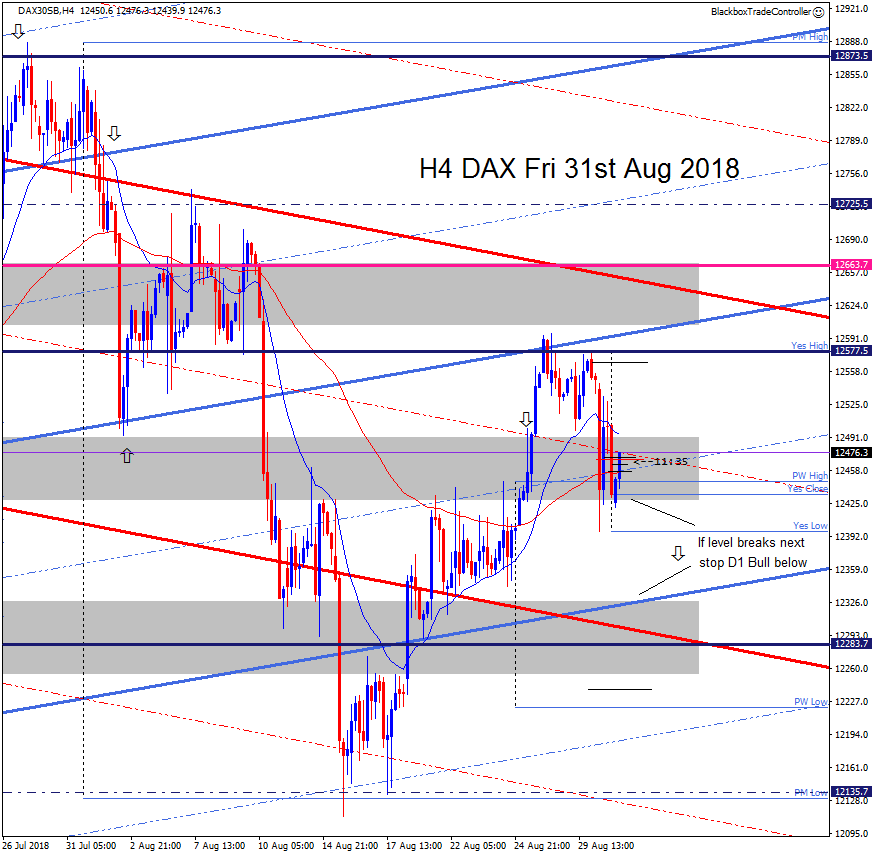
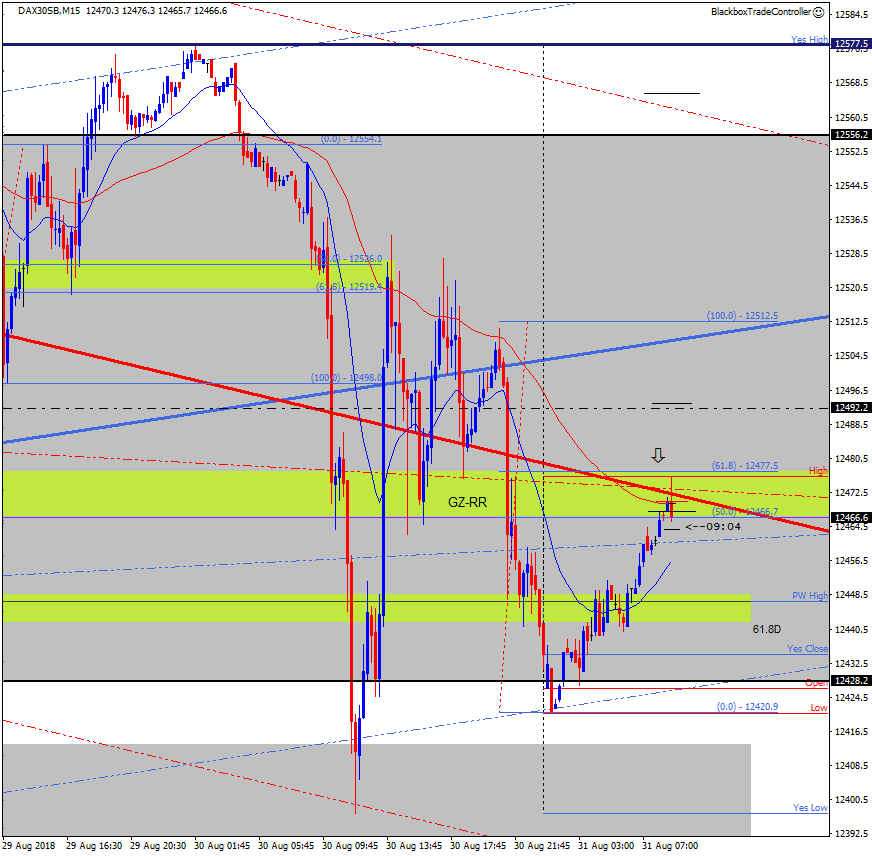
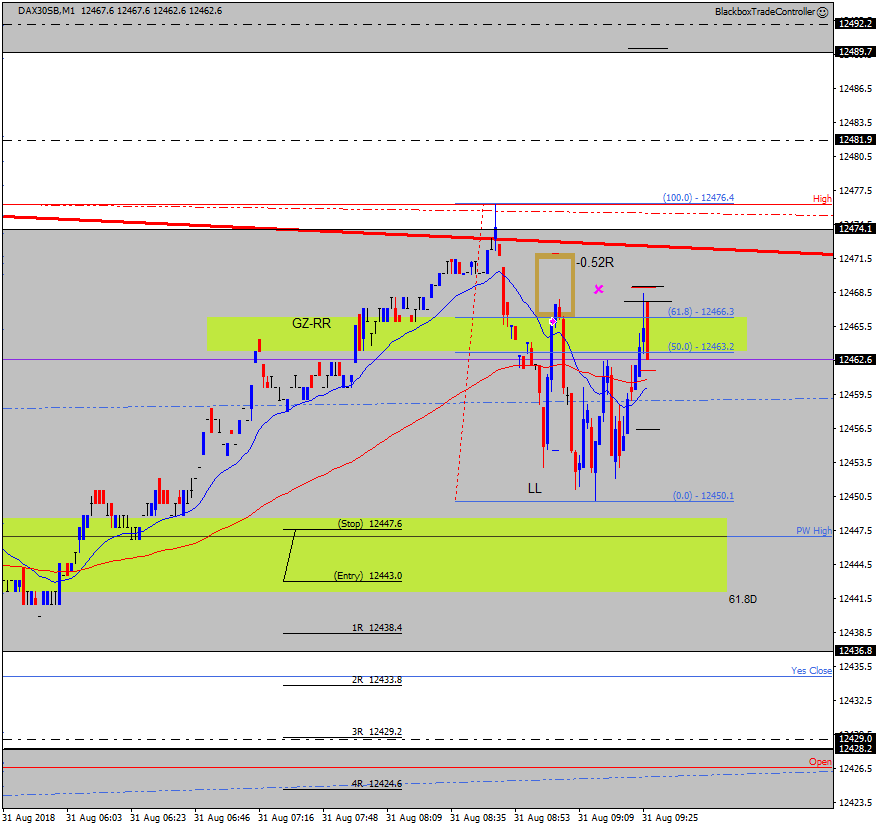
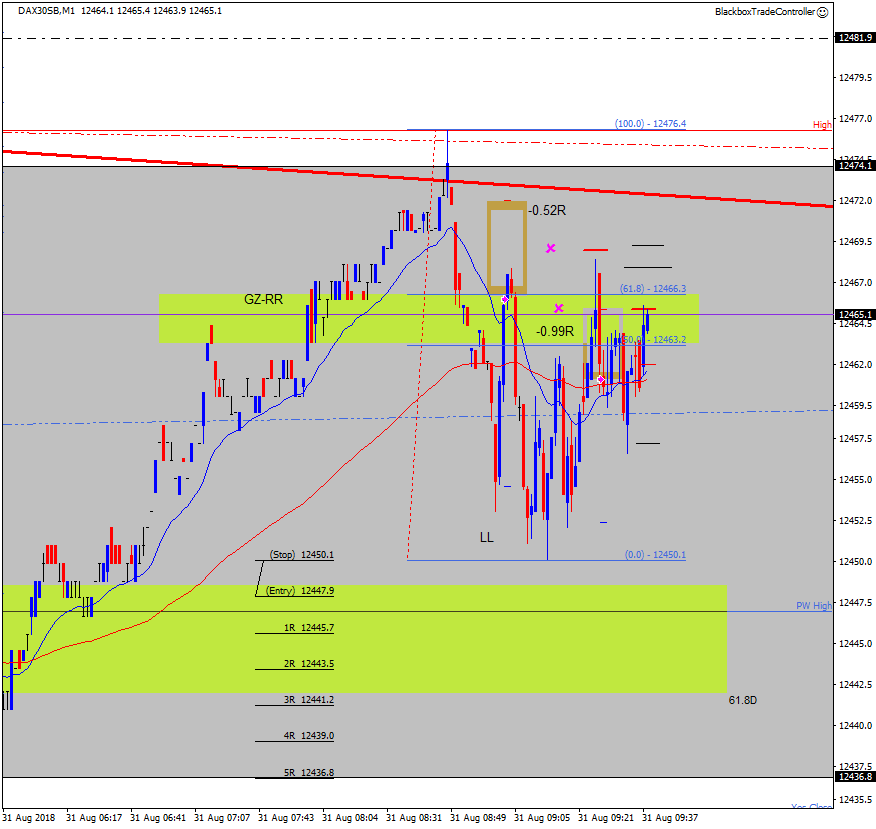
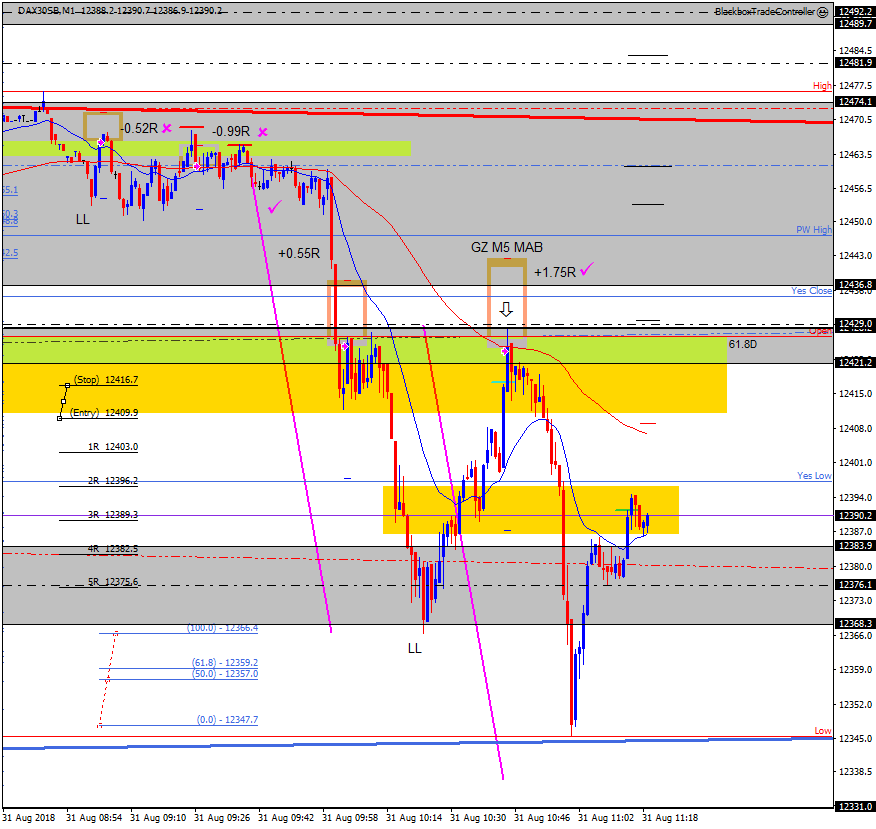
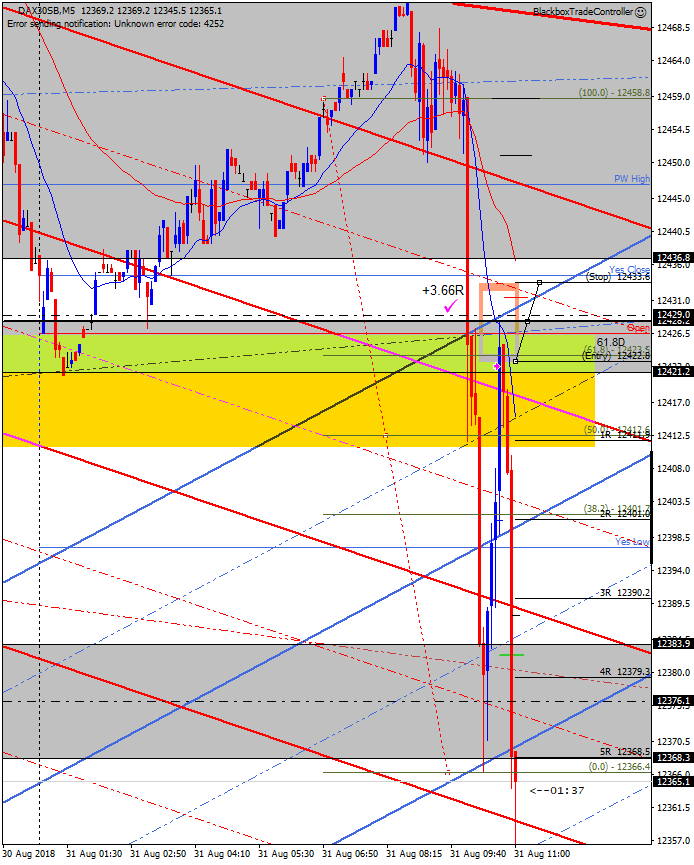
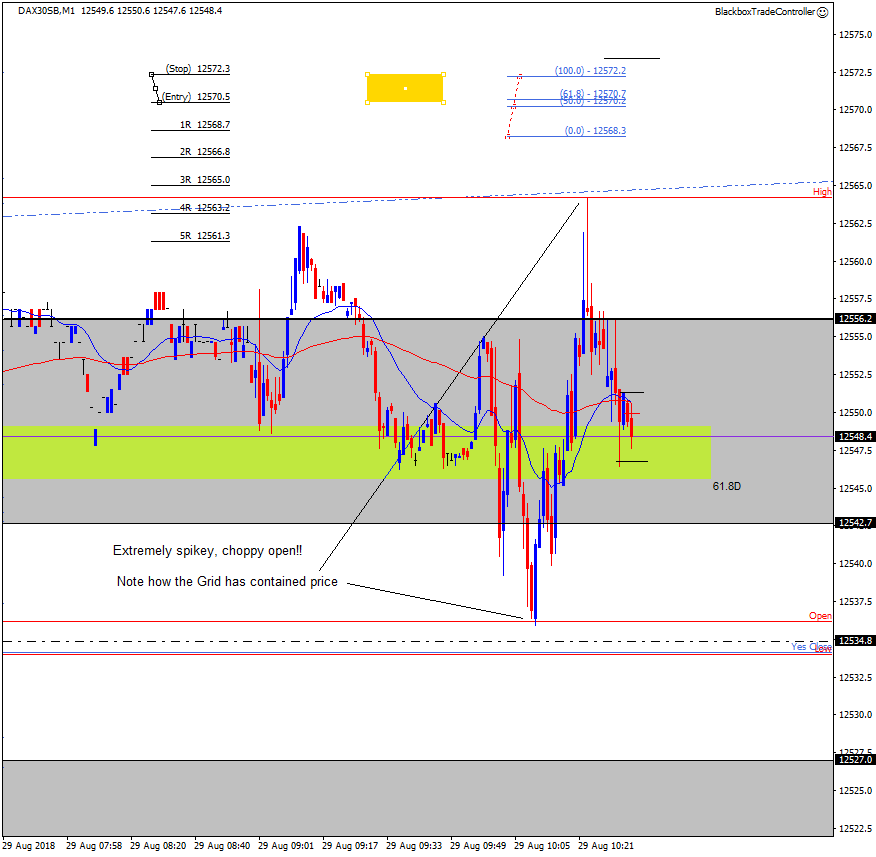
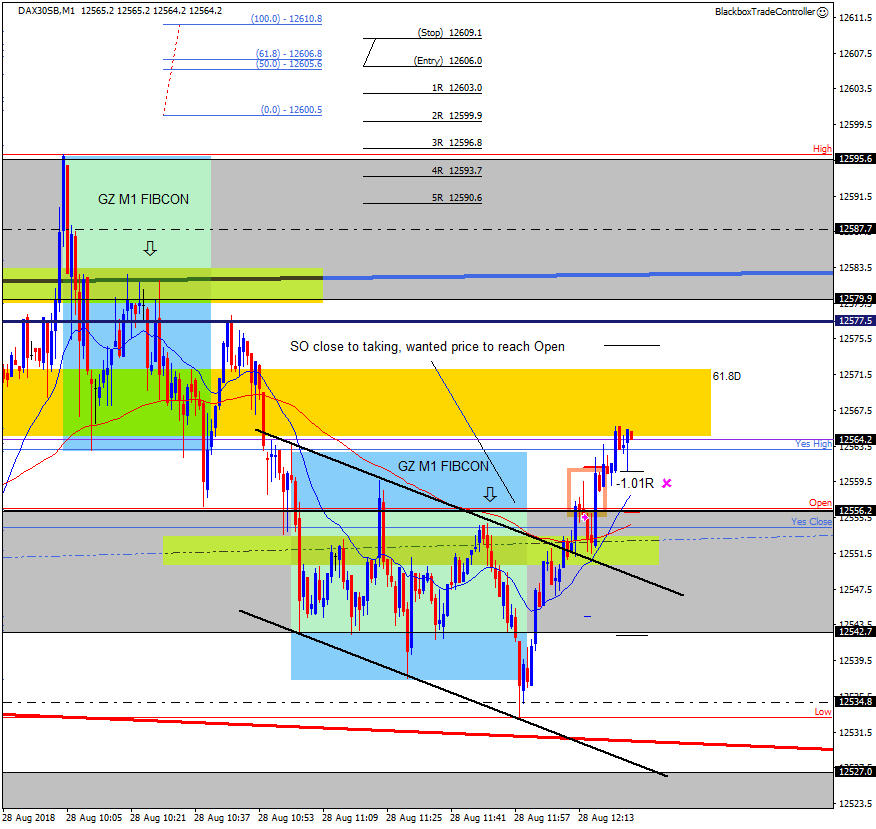
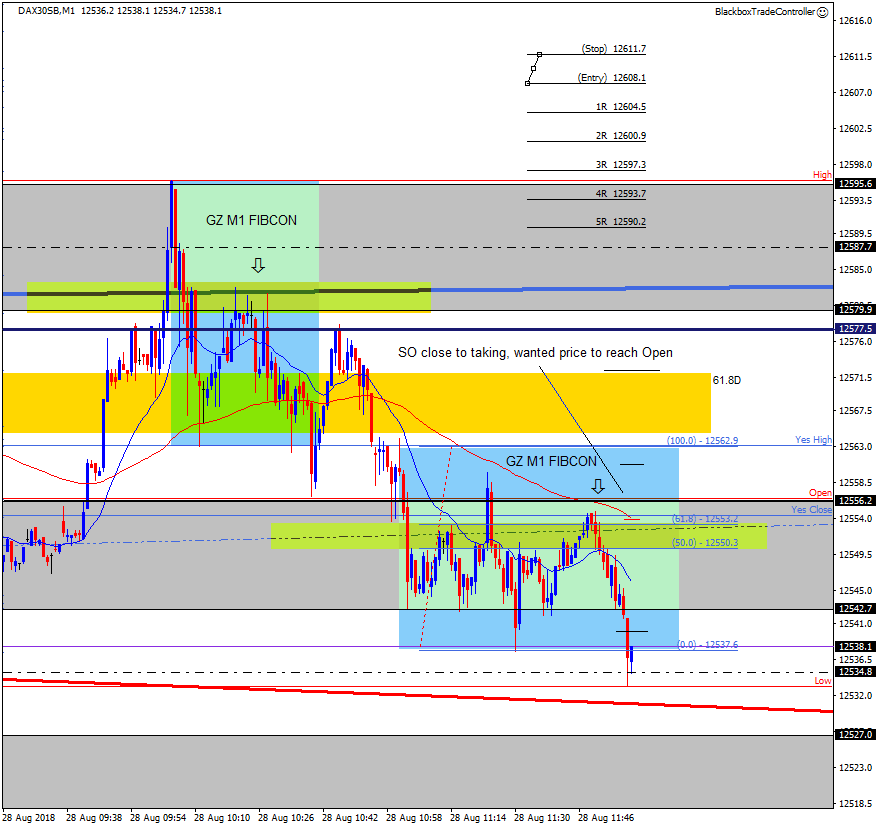
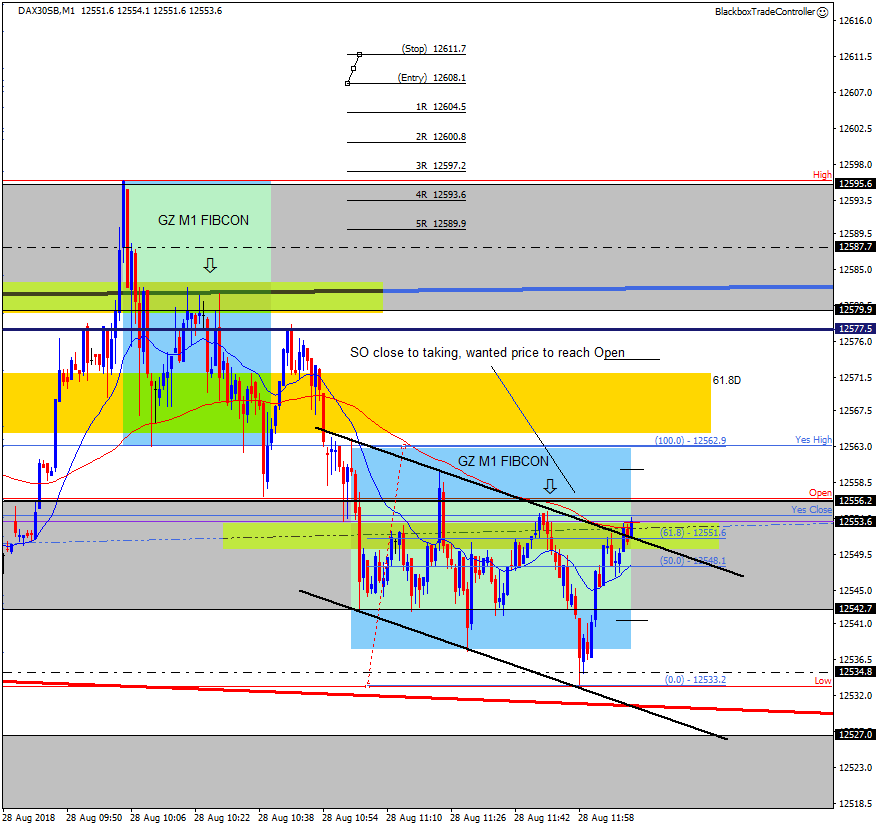
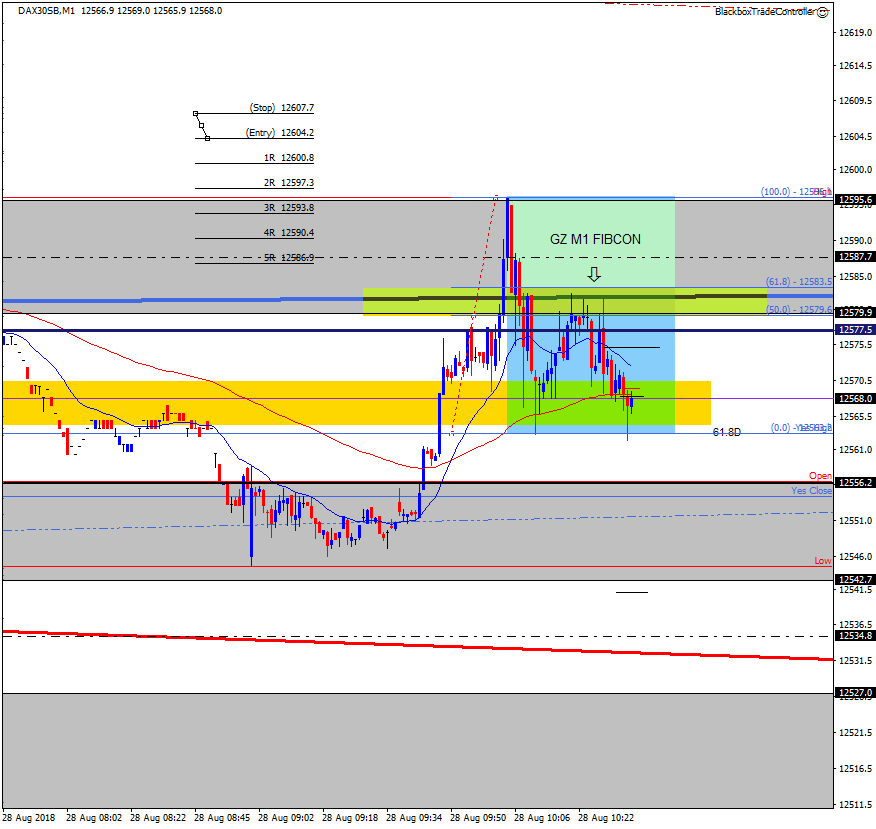
What makes this one really cool is I anticipated it well in advance, see the the screenshot below.
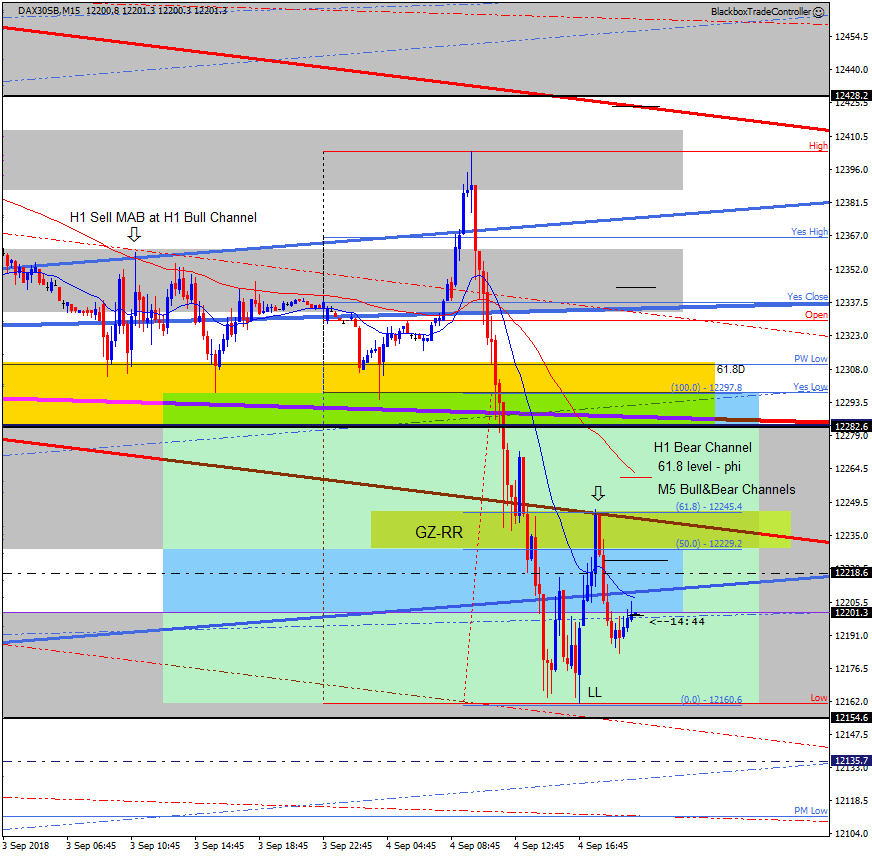
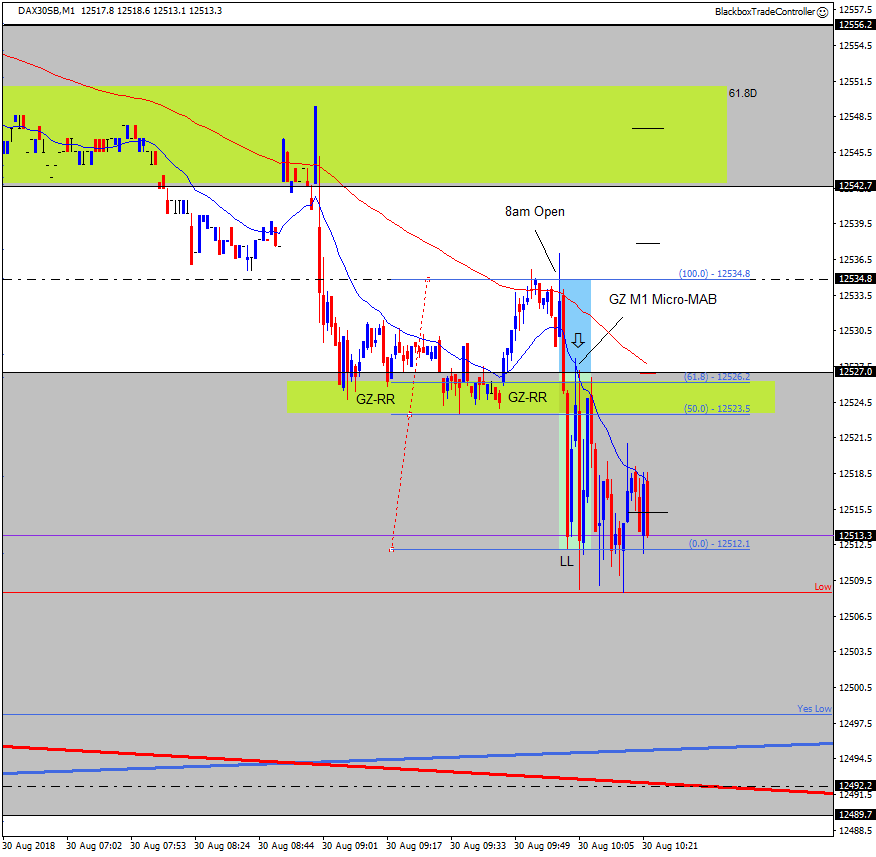
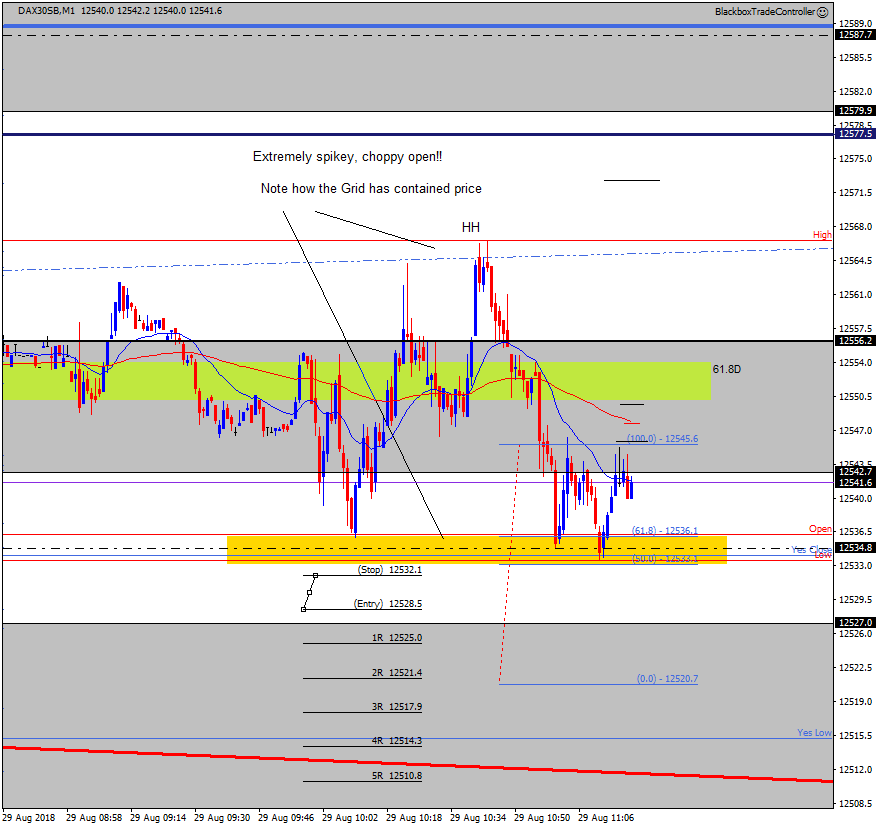
Whilst price was in the choppy range after 8am I decided to wait for price to break below the session low, at that point it was at the Open/Yes Close. The ideal Golden Sell Zone I reasoned would be a retrace to the current session low where the:
- Open
- Yes Close
- M5 EQZ Mid-line at 12534.8
would all act as confluence to support the sell setup.
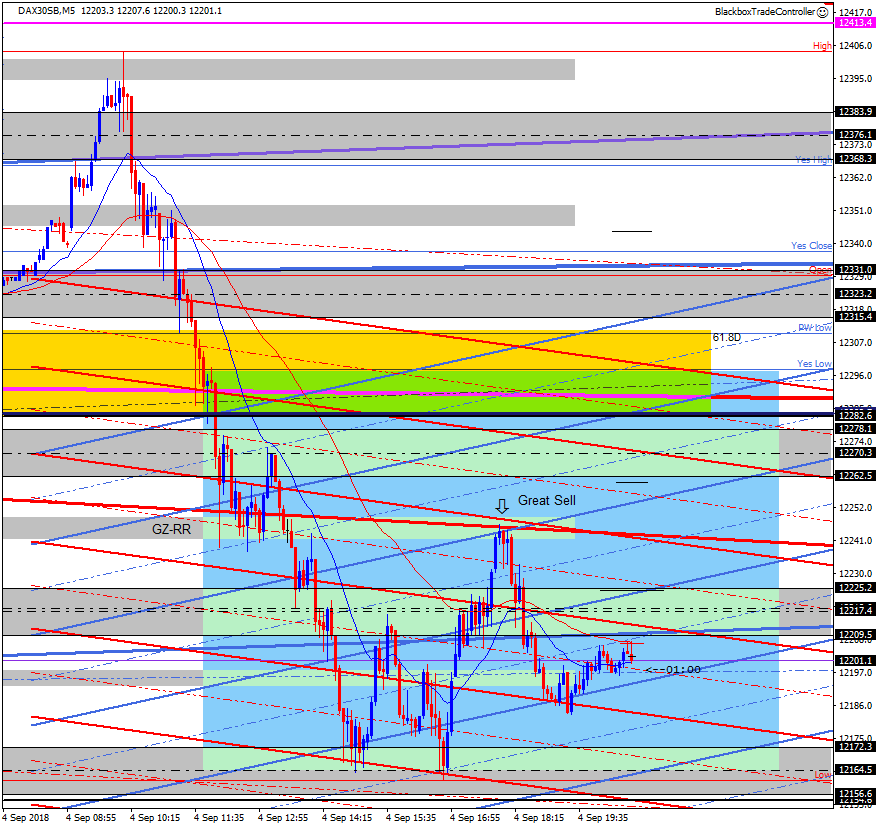
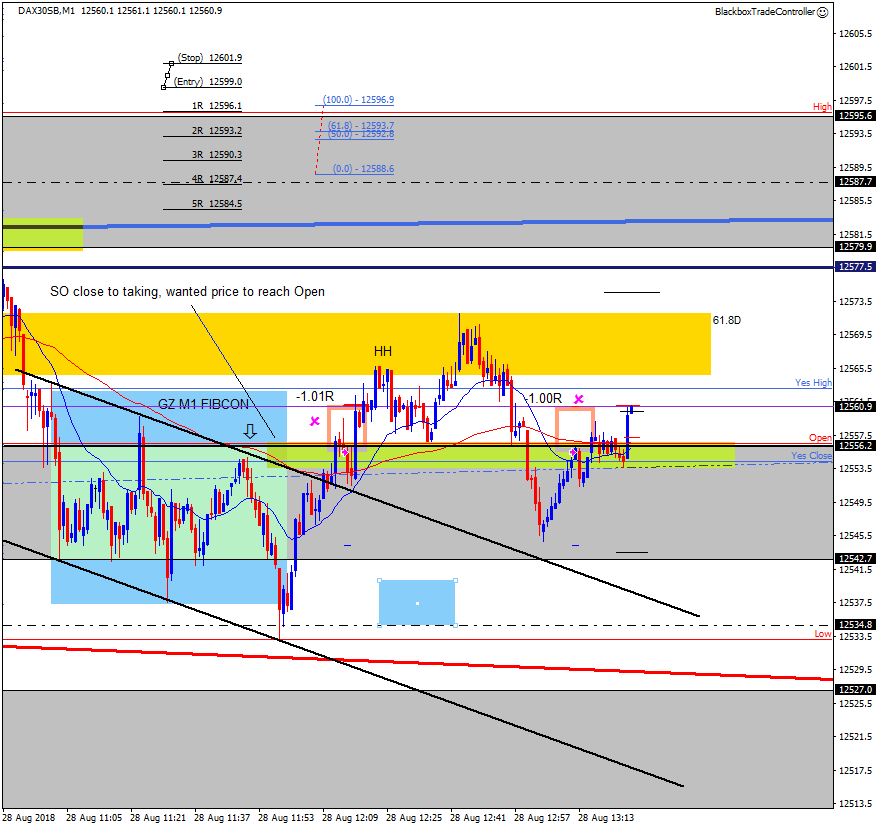
Based on this I was able to project where point B (the Lower-Low) would need to reach to support this setup. The screenshot below shows this marked up with 12520.7 being the level required for the perfect ‘Golden Zone’ sell structure to form.
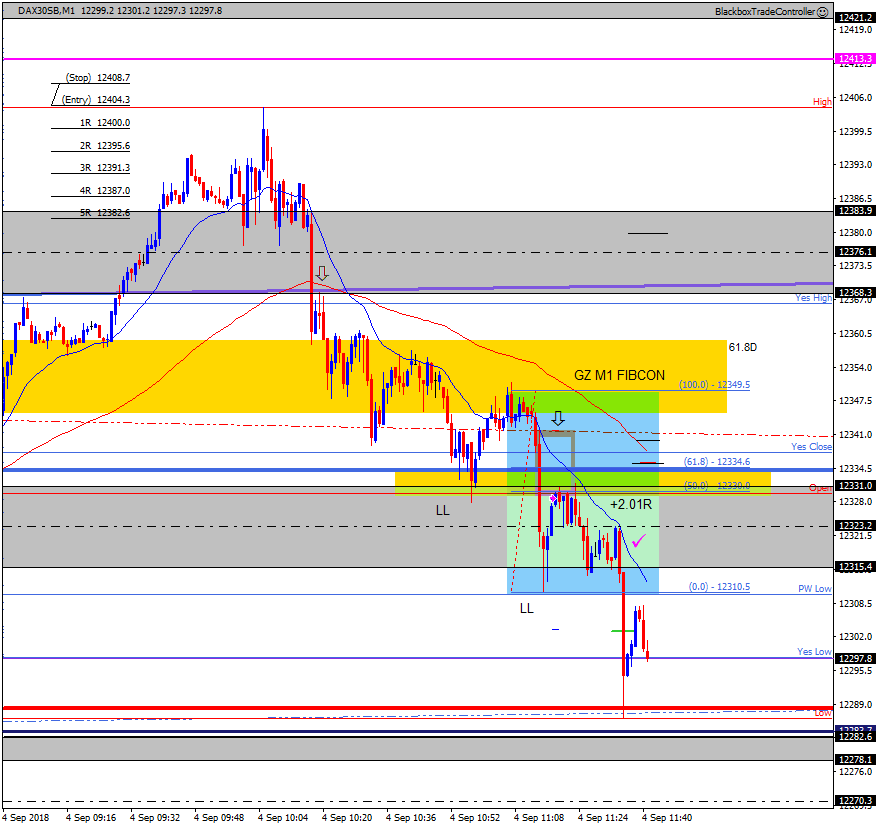
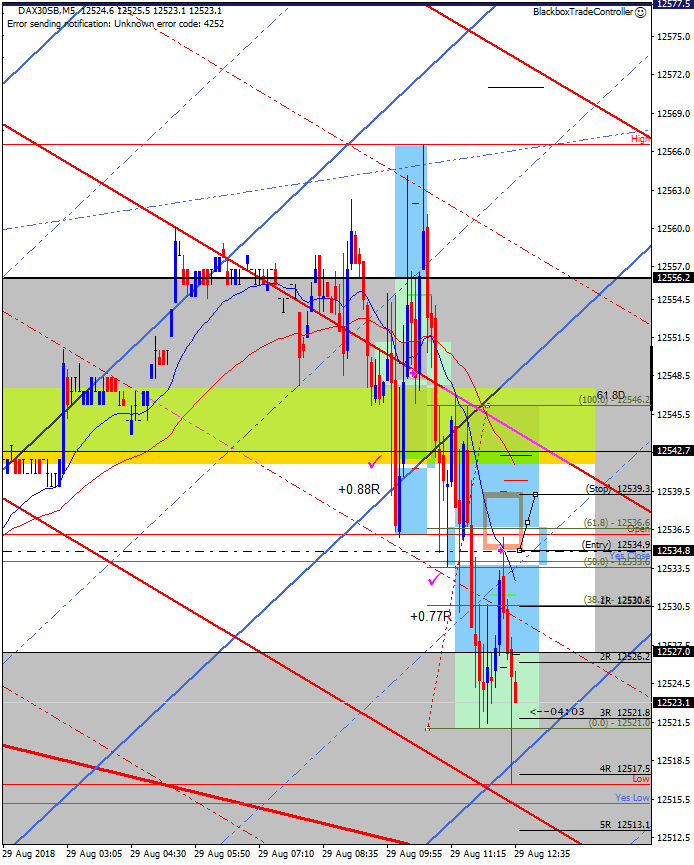
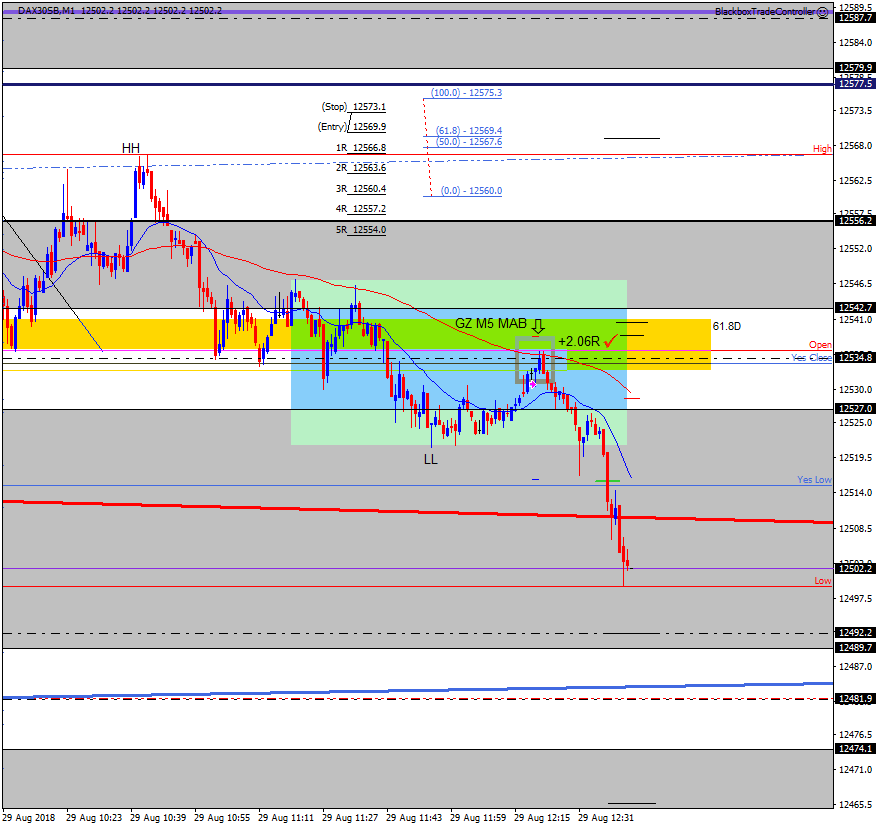
Things played out perfectly, the only thing I would change is to have waited a little bit more to get the best value entry but after a few occasions recently where I’ve been too fussy and missed the trade entry I entered as shown. This meant my 2R profit target was lower than originally planned but the trade went on to be a winner 🙂
Note: On the screenshot above showing the winning trade the session’s ‘Golden High-Low Zone’ has moved down due to the session low moving lower, it has therefore covered the sell ‘Golden Zone’ that was used to enter the trade. This zone is shown below on the screenshot predicting the setup.
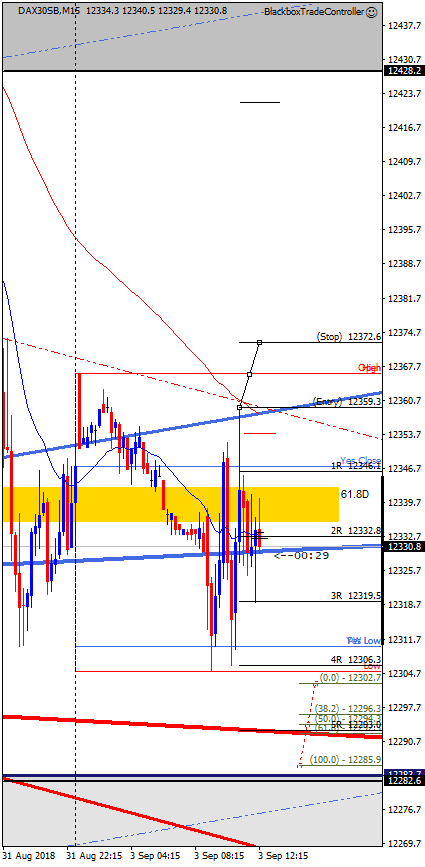
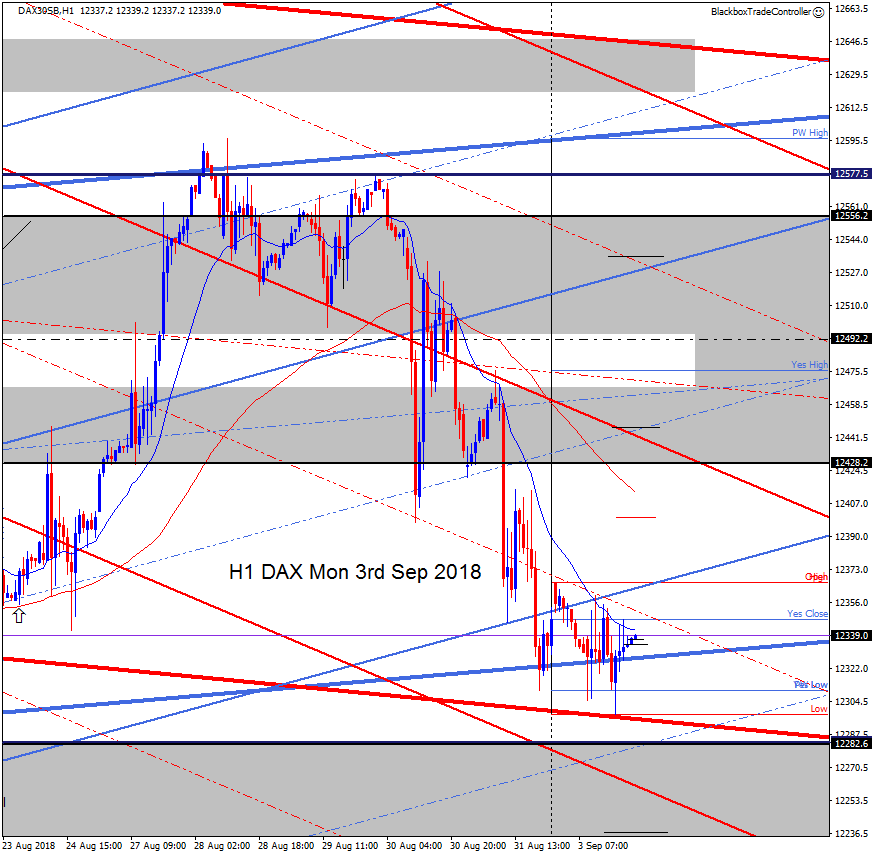
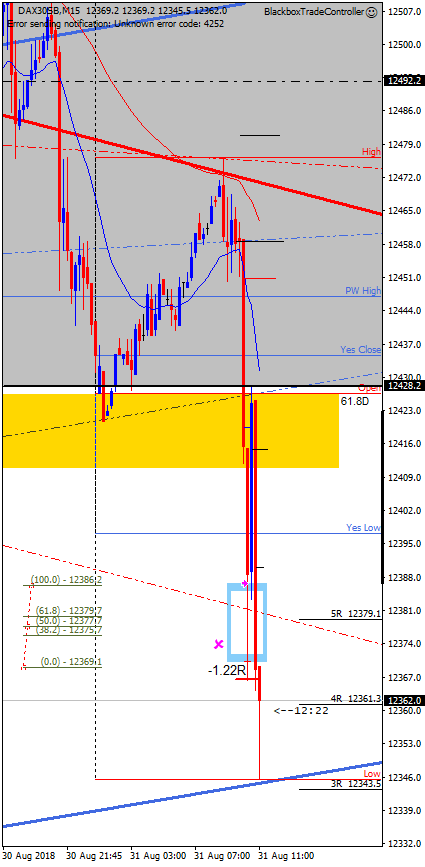
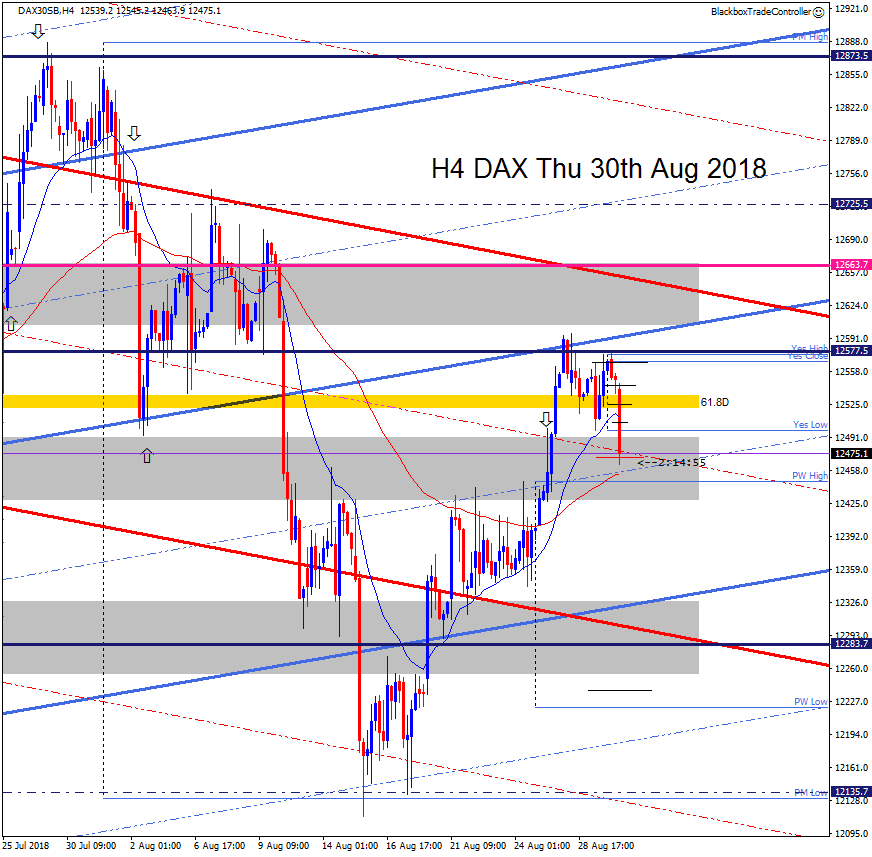
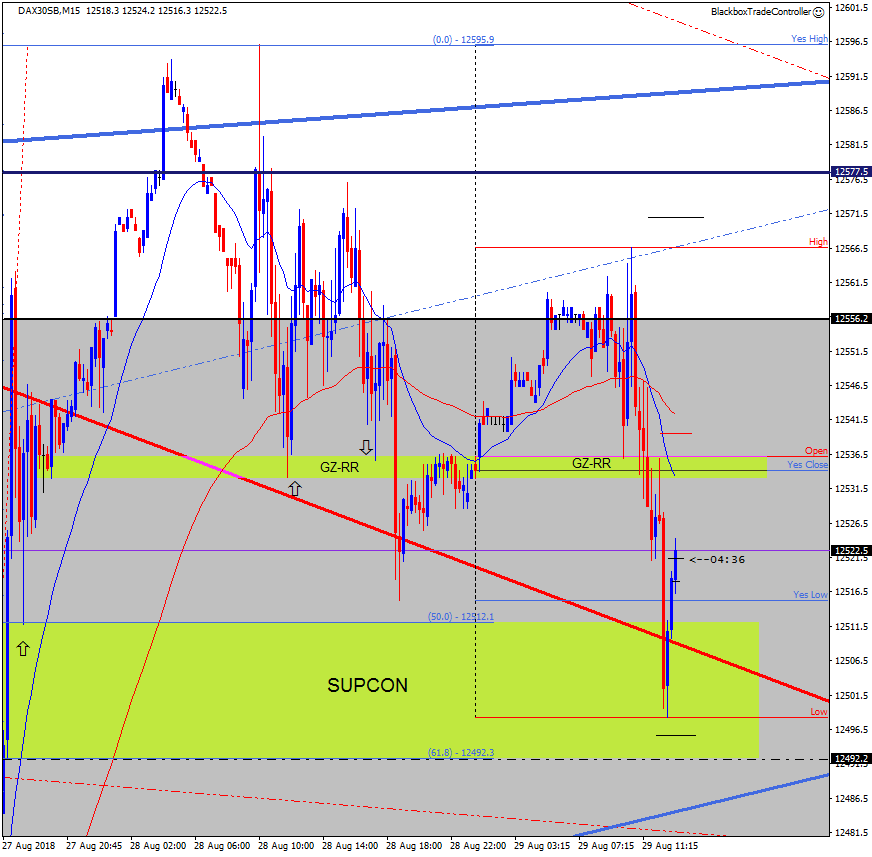
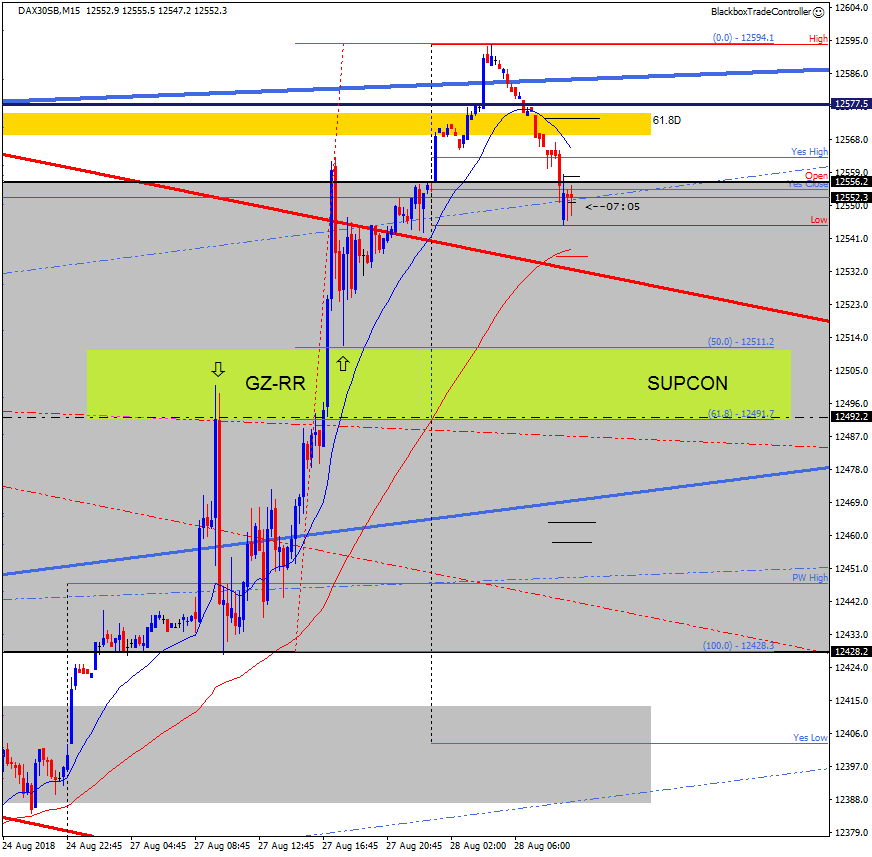
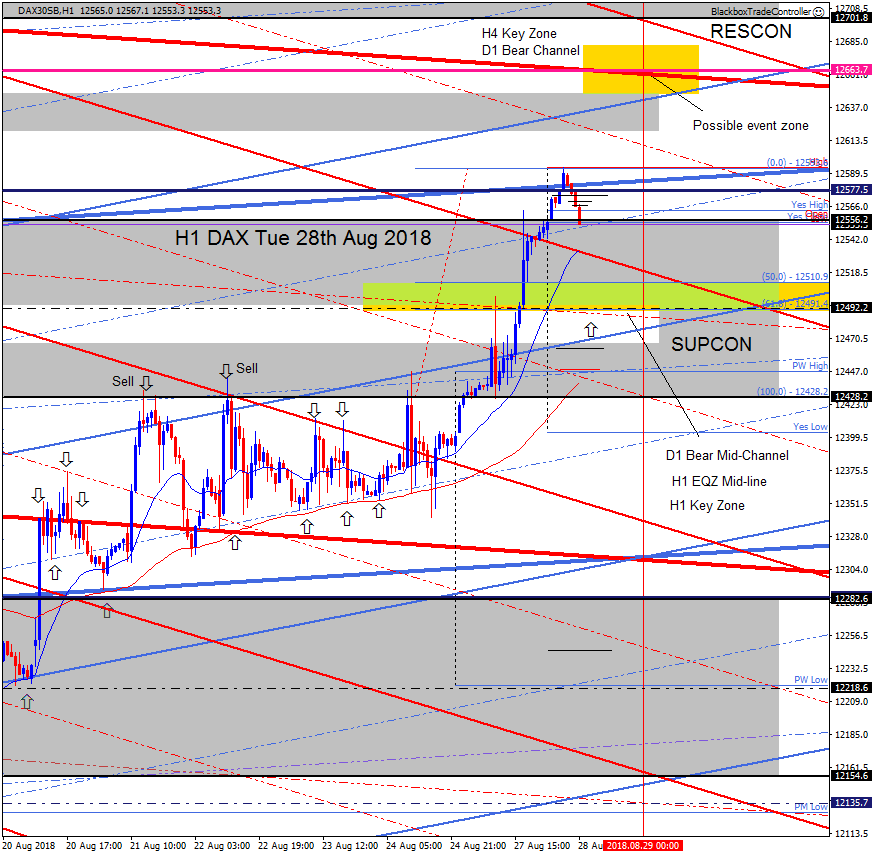
What was ideal about this zone was that it had great Role-Reversal price action when looking-left, see second screenshot below of the M15 chart, the arrows show this. This is a great example of why we use our custom setup where a second install of MT4 is displayed on a second monitor to provide higher timeframe context at a glance.
Below is the screenshot anticipating the sell setup, point B needed to be approximately at 12520.7 and that’s exactly what happened 🙂
Note: This was not luck or a one-off. This type of reasoning comes from commitment and passion to studying Price Action day in day out!!

