Thu 18th June

End of Day Review

+1.86%

4 trades taken.

2 winners, 1 loser, 1 break even.

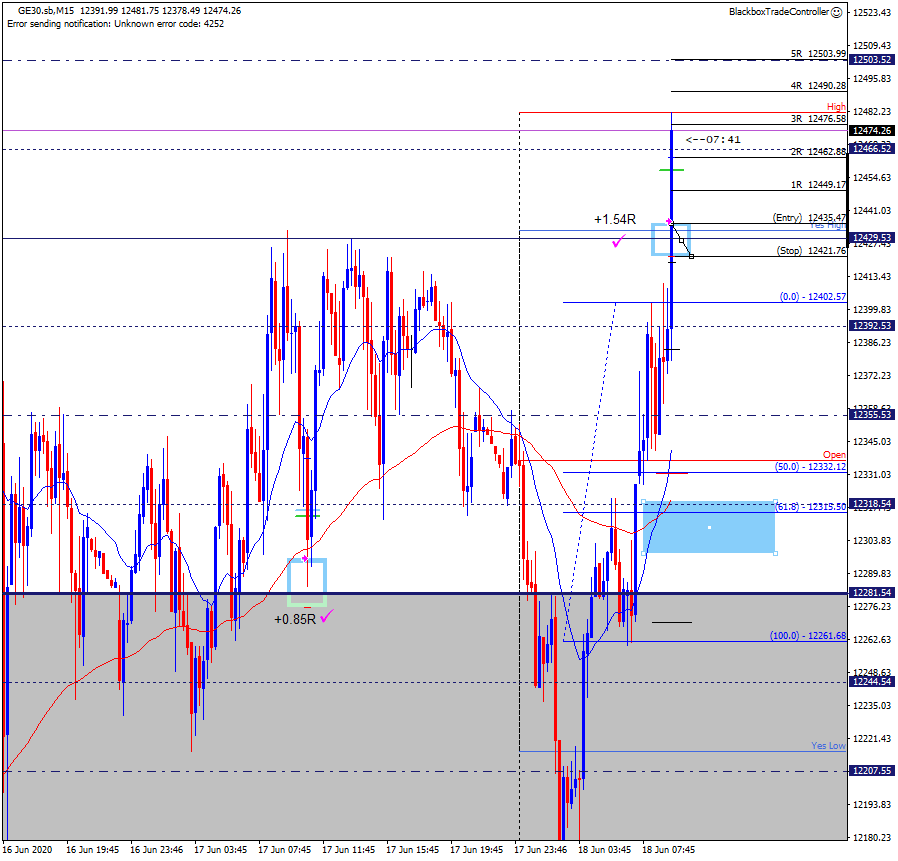
09:33

Resistance Breakout winner | +1.54R

Call them risky, low probability, but I always had a thing for this kind of trades.

If you are looking to price (and by that I mean, every movement that price is doing every second or so), it’s not hard to anticipate that a breakout attempt is coming. There are cases where below the resistance level all of the sudden price starts to move up with great energy, and if that energy causes price to stay above the resistance level for a few seconds, the set up is on.

I could have left it on for a bit more, but looking left there was some wicks in the past that could serve as role reversal levels, therefore I happily took the profit.

I must say, every time I take this trade, as soon as price goes around 0.50R above my entry level, I move my stop loss to breakeven to prevent false breakout attempts from giving me a 1R loser.

Also, note the BuyLimit order placed around the 12318.54 level, it will come into play(adapted to the new price action) an hour later.

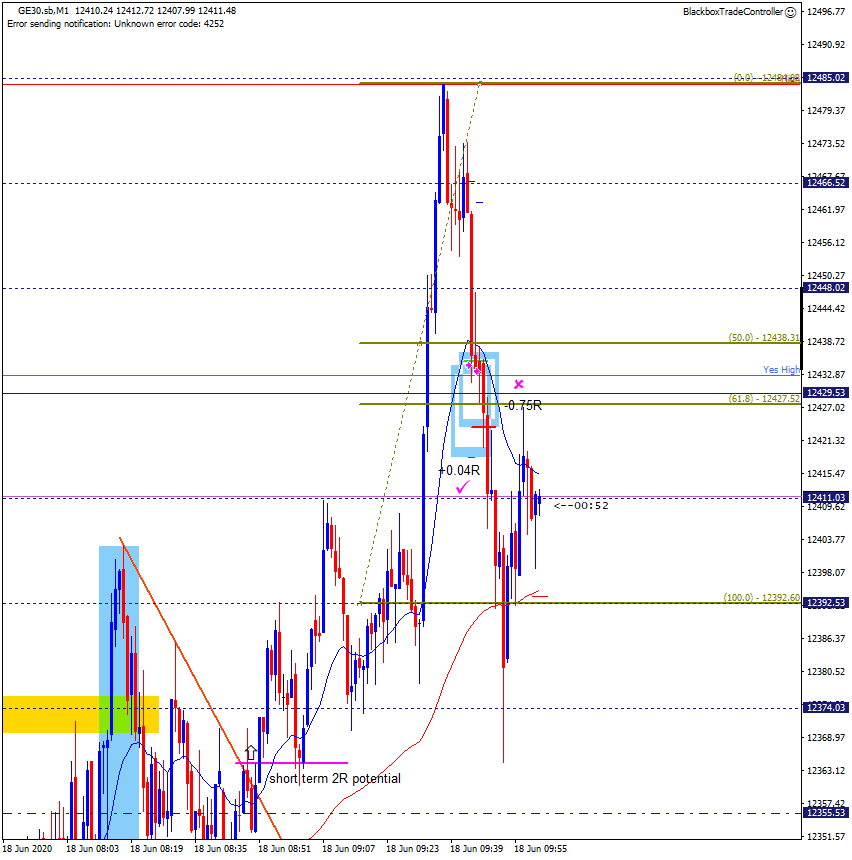
09:44

M1 Buy FIBCON failed pair of trades | -0.71R

I really liked this one, having in mind (not shown in the chart) how the area around the Yes High was of strong resistance in the past I thought a FIBCON could be in place, helped by the M1 Moving Average going up.

When I opened the first trade price moved up quickly, therefore I moved my stop loss to breakeven level to protect my previous profit.

After taking me out, the next two minutes I saw them as consolidation of the price at that level, which I took as a bullish sign and entered a second trade with a more attractive 2R level. 

However, bears took over, drove price down aggressively and took me out of the trade. The -0.75R was originated in a change in price at the moment I entered the trade, modifying my risk/reward. 

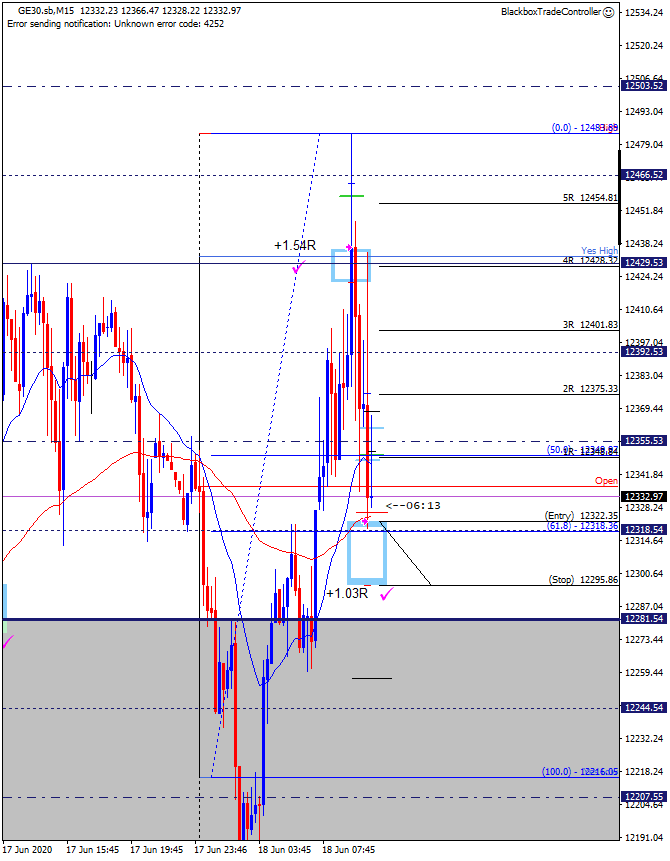
10:39

H1 MABCON locked in profit | +1.03R

On my first trade I had a BuyLimit zone already placed from before price attempted the breakout. After such price action, I updated the possible setup, placing the FibTool between YesLow and this session’s High. The result: the H1 MAB coming up slightly above the 61.8 level and above the 12318.54 level, an area that acted as support yesterday!

However, I went away because the market was still far away from this level, but when I sat back down I see that tremendous candle that touched YesHigh and came down very fast near the Open level. 

I waited for it, hoping it would lose some of the impulse, and it just reversed after my trade, as if I had any power over the market with my tiny trades!! 🙂 

Conscious of the energy of the movement down, I set Lock In Profit levels and left it alone. After being slightly above +1.5R, the bull run was over and it took me out at +1.03R.

I still need to be able to enter these trades with more confidence on the M1 chart, with a lower 2R target, but I will eventually get there to max out each trade.

Wed 17th June

End of Day Review

The day of great setups and a lot money left on the table!  

+2.15%

5 trades taken.

3 winners, 1 loser, 1 break even.

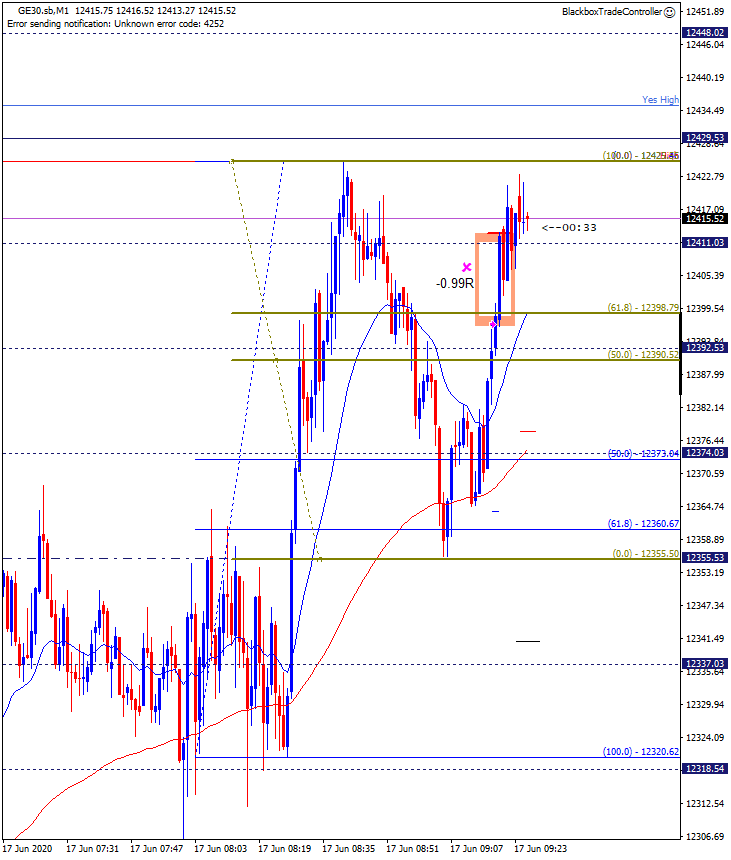
09:18

Failed M1 REVFIB | -0.99R 

Low probability setup? 

I didn’t have enough structure to support my trade. I guess it was more related to my desire to catch one. Will have to thoroughly review how and when they form in order to master these trades.

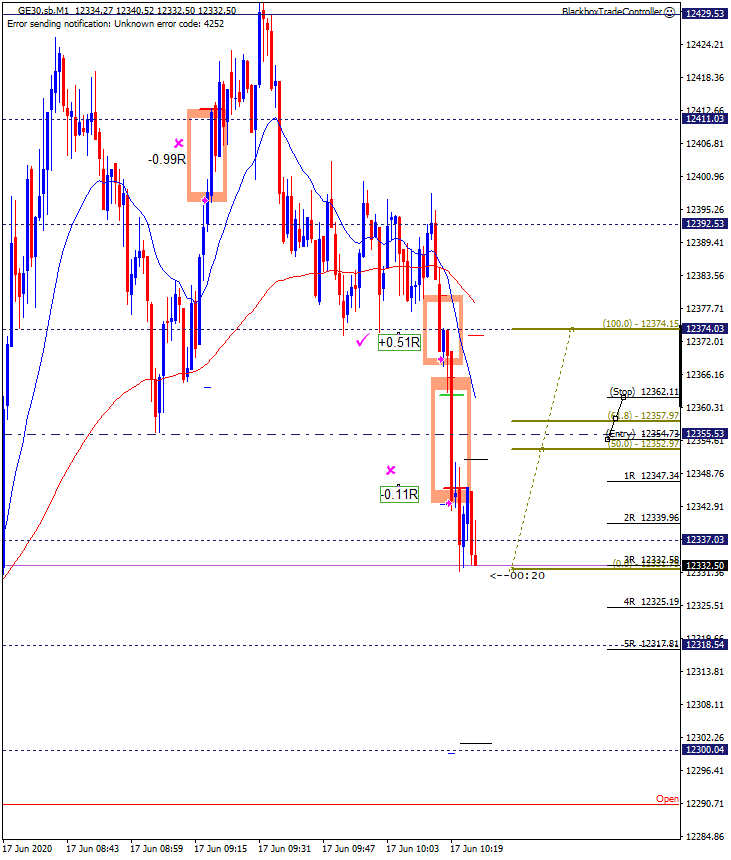
10:17

Wild entries | +0.40R  

Ok, none of the above were planned like that.. 

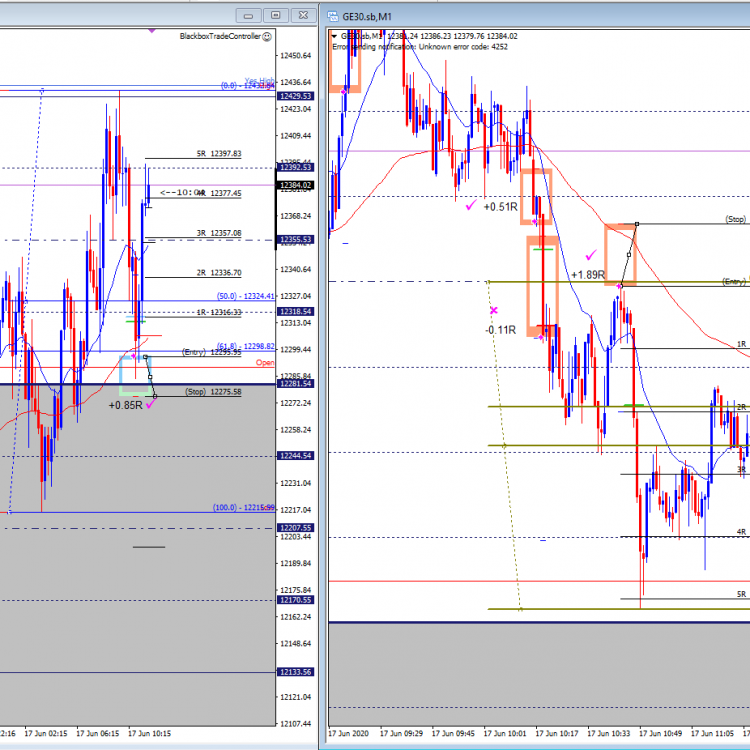
On both ocassions price was moving so fast that between the time my brain decided to press “Ctrl+E” to take the trades and the time they executed, the entry level on both was different to what I planned, particularly on the -0.11R trade.

Now, execution was poor, but the idea was there: 12374.03 bulit as support, and I started to see Lower Highs forming and had the trade tool ready to go. However, two minutes before my +0.51R trade, price moved up and seemed like going above the 12392.53 grid level, so I deleted my trade tool and looked away. In no time price moved down, broke the support and I arrived a bit late. Hesitating as to whether the trade was good or a price chaser I manually closed it. I will not lie here: 2 seconds after, price broke the key 12355.53 level marked again on the grid. I rushed the second trade, but when pressing Ctrl+E, price moved wildly down and gave me that horrible looking entry that I quickly closed.  

10:43

10:50

M1 Reversal FIBCON | +1.89R (5R 2 after 2 minutes)

M15 FIBCON | +0.85R (5R after 5 candles)

Great structure, great anticipation (if you see my previous screenshot on wild trades, you’ll see where my trade tool was placed, that’s almost exactly where I took the +1.89R winner), poor trade management.

Don’t get me wrong, I am proud of having been involved in those trades. Even a 10R wouldn’t have made me a millionaire at this point on my trading journey, but anticipating these set ups will definitely get me closer to it, therefore today is a great day!

Wed 17th Jun

Welcome to the daily DAX commentary where we share with members our unique take on Price Action as the session unfolds. We comment on trade setups that conform to our Trading Edge and how we use the hybrid Blackbox Trade Controller for MT4.

Use the comments section below to post questions and read what others are saying.

Remember to:

12:04

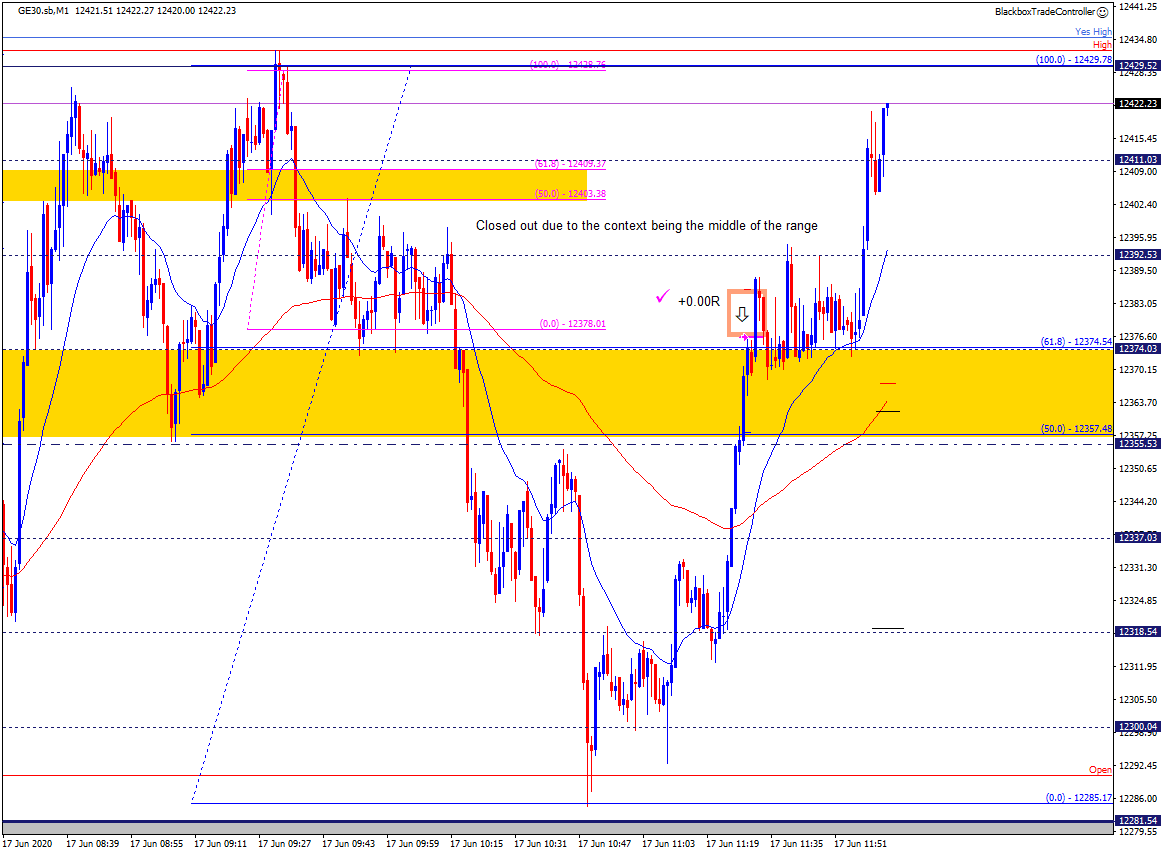
Middle Of Range Sell Low Probability?

I took the sell setup at 12374 without fully concentrating, however, I closed out once I reaccessed the context, it proved a good call.

Why?

If we are in a range then the middle of the range setups that are opposite to the direction price is moving can be low probability. In this case a sell trade against the momentum of the move back up the range.

We will update the section on the website with rules for trading ranges.

One such rule is that (in this case) we favor buy trades over sell trades whilst price is moving back up OR stand aside until price reaches the TOR. We can set alerts to inform us and take a break whilst this plays out.

We can never know for sure what will happen, at times these middle of the range setups work out but we must learn to deal in probabilities and context.


10:32

Sharing Comments

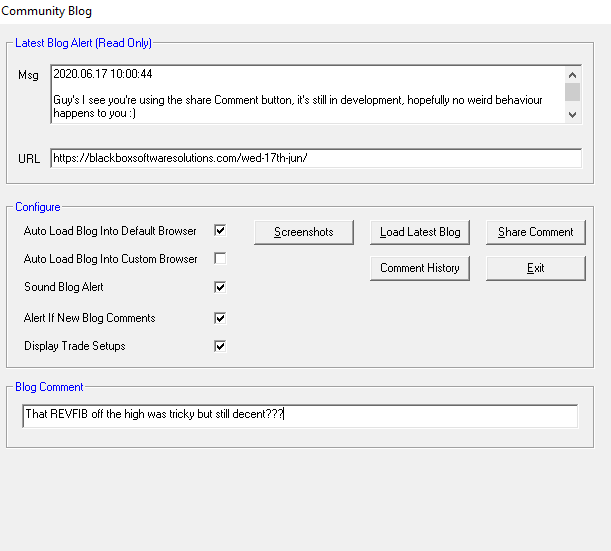
I’m about to upload the latest BTC, the Community Blog window has been updated as above. You can add a comment of up to 200 chars if you want.

The ‘Share Comment’ button will notify others that you’ve posted a comment on the blog. 

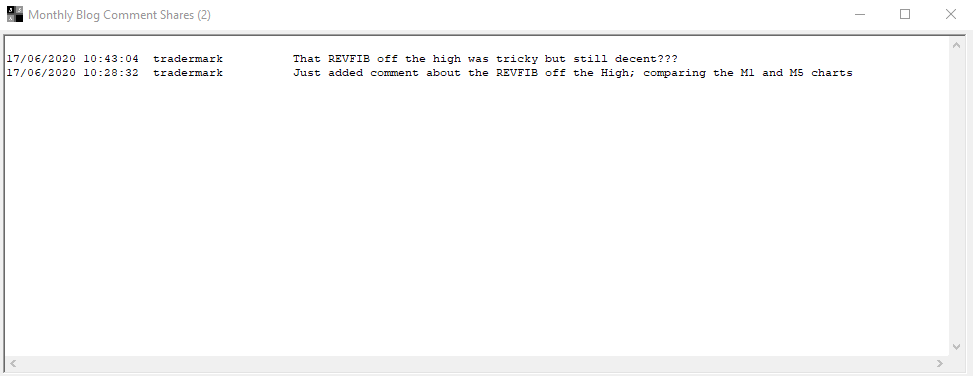
When new comments are shared you will be alerted and they will automatically be displayed. If you want to look at the comment history at any time use the ‘Comment History’ button.

This is not intended to replace posting comments on the blog, just to allow you to tell others without me sending out a blog update.

However, it can be used to send a simple one-liner if you want.

Start using once you update and we’ll see how it goes. Below is what the display will look like. It’s a floating window showing the current months shares with linefeeds between days.

09:59

 Shae Comment Button

Guy’s, I see you’re using the ‘Share Comment’ button. 

Are you getting notifications?

It’s still in development, will be completed later today.

09:05

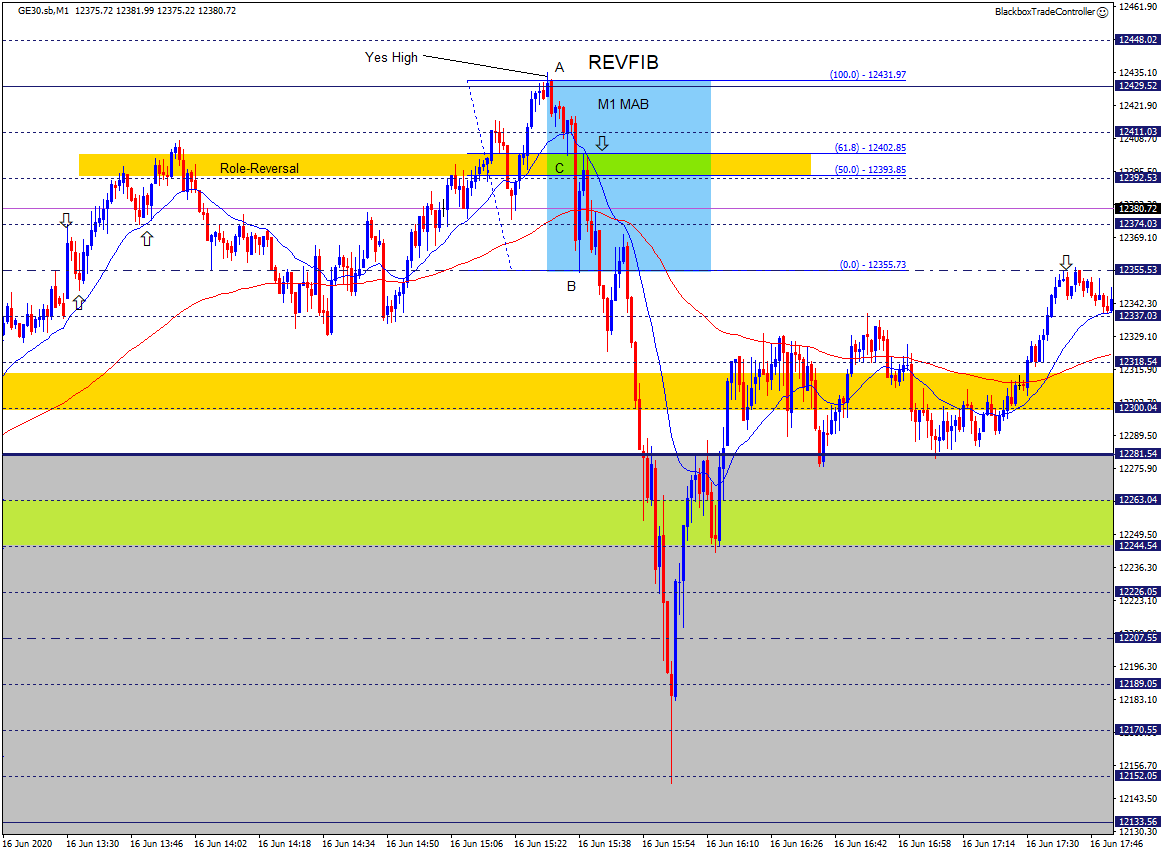
 Yes High at Key 61.8 Level

After reading the comments below from Alex and Joel regarding the Daily GZ and Yes High I took a look at what happened on the M1 chart yesterday afternoon – Wow!!

As they commented, by identifying this structure we can reason out that there might be:

  1. A move up to it offering buy setups (Joel)
  2. A possible sell setup if price fails to move above it (Alex)

A sell REVFIB formed with great structure and context 🙂

Note once again that:

  • Point A was at a Grid midline level@12429
  • Point B was at a Grid midline level@12355
  • The GZ 50% level (point C) was at a Grid midline level@12392

This is way beyond coincidence and each day we are seeing how precise the updated Price Action Grid is.

When we get used to seeing these chart patterns (GZs) they offer multiple R as can be seen by what happened. A reasonable target would have been the D1 EQZ@12281.54

The updated s/w will allow us to share more effectively this information. Even though I’ve not been trading the last few days I’ve really enjoyed feeling the synergy that’s developing between us. It’s time to take things to another level 🙂

07:20

GZ M1 Buy FIBCON

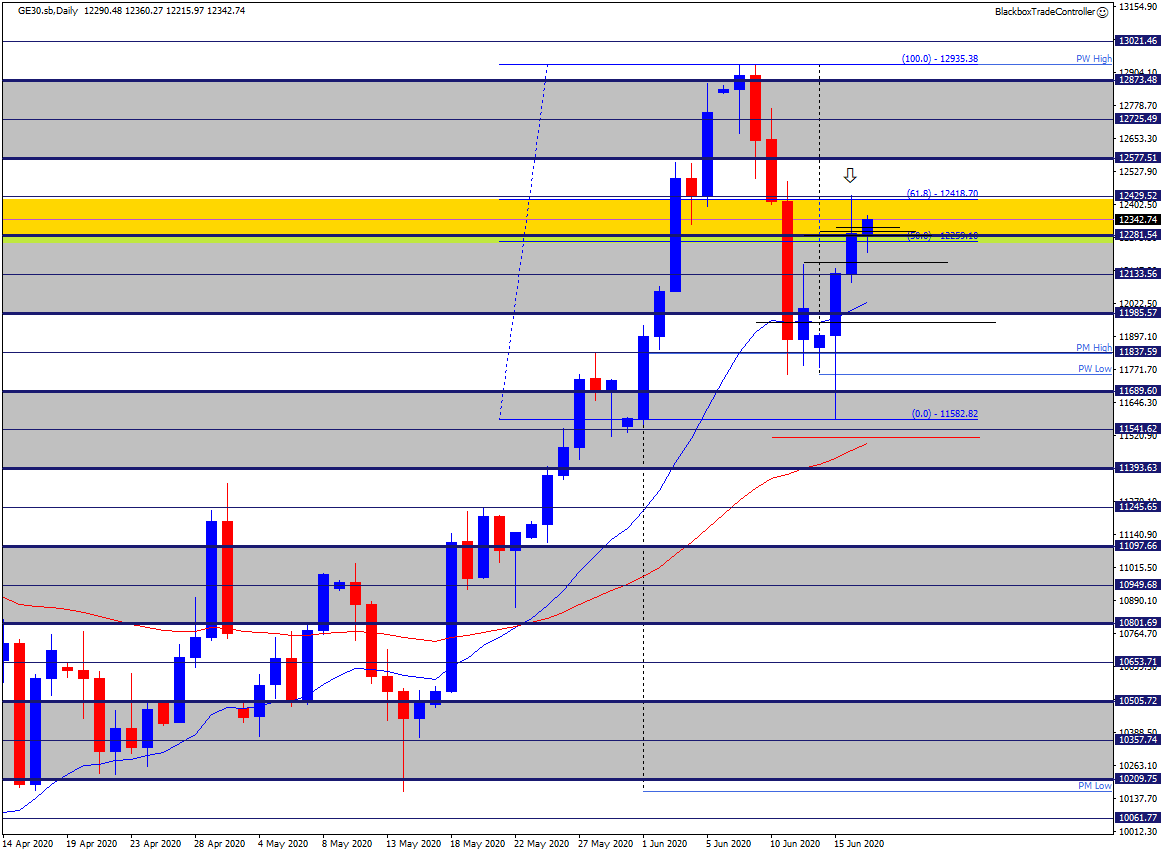
Yesterday’s High was just above the midline of the D1 EQZ@12429, it was also the 61.8 level of the GZ marked up at 12418, when you look left you can see that the midline was in play during last week.

Also, note that the wick on Yesterday’s candle is pretty much the height of the GZ. 

Today I hope to complete the s/w updates ready for release.

Tue 16th June

End of Day Review

+2.17%

2 trades taken.

1 winner, 1 loser, 0 break even.

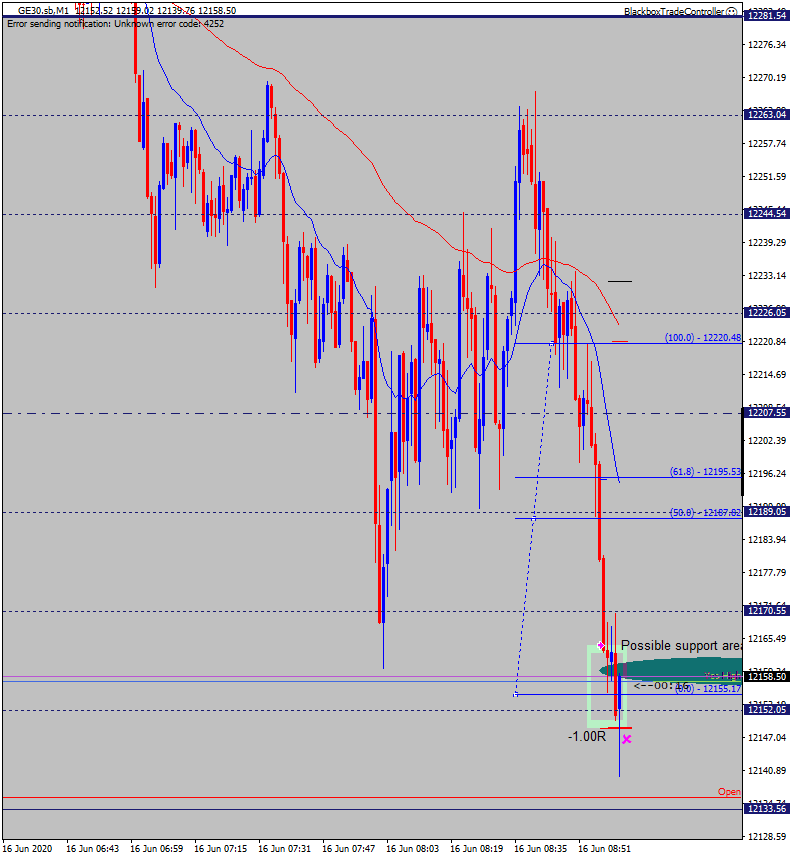
08:57

Failed SUPCON | -1.00R

I had marked a possible support area earlier on this morning, and when price approached it that fast, I jumped the gun and entered the trade.

I could have waited a bit more, but given that after my trade the next two candlesitcks were still there, I am sure I would have entered the trade anyway. 

Didn’t work, not particularly an edge trade, so I should really save these kind of attempts for the future once I start to read the market a bit better. 

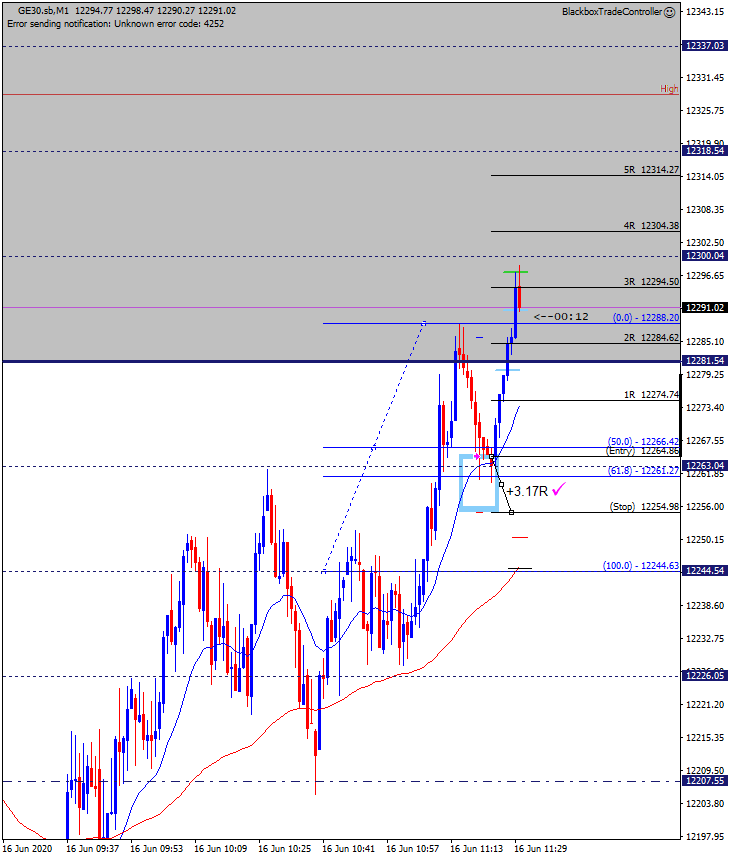
11:20

M1 FIBCON Winner | +3.17R

Oh boy I was longing for a trade like this one.

Right when the feeling of relegation was starting to kick, it felt like a last minute goal that saved me from falling deeper.

It wasn’t free from emotions I must say. After I entered the trade, that candle and the next two stayed hoovering around my entry level. I was like “why does it need to hang around there? Just go up!” I’ve seen so many cases where price effortlessly retraces that those 2+ minutes of indecision were painful. I set my lock in levels (you will observe two small horizontal lines, one between 1 and 2R, another one above my 2R level) and I went away.

It was a recomforting to come back with price above my 2R level and about to touch my target price. 

There was role reversal (multiple times if you keep looking at the left on the 1 /5 or even 15 minute charts) and there it was the M1 Moving Average going up to help the reversal. That’s Blackbox’s edge. 

Tue 16th Jun

Welcome to the daily DAX commentary where we share with members our unique take on Price Action as the session unfolds. We comment on trade setups that conform to our Trading Edge and how we use the hybrid Blackbox Trade Controller for MT4.

Use the comments section below to post questions and read what others are saying.

Remember to:

13:59

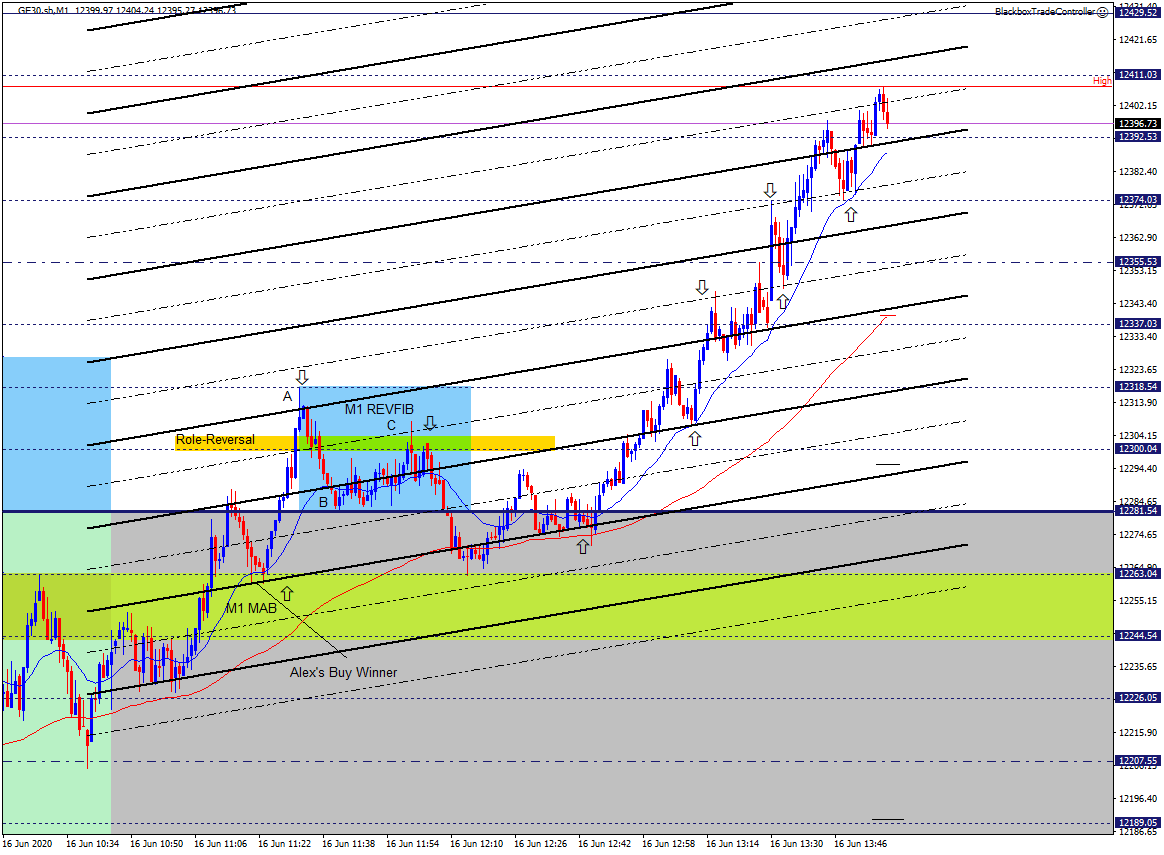
M1 Bull Channels

I’ve just taken a look at the charts and thought I’d see what the M1 Bull channels (plus midlines) look like since the bulls are currently in control.

In particular, note that Alex’s M1 buy MAB was PERFECTLY confluent with a channel boundary. 

I’ve added a few arrows to show where price has clearly interacted with the channels, this is a great example of the ability to add/remove channels from the chart depending on how helpful they are. 

We trade primarily horizontal levels, then we overlay channels to see if they add additional confluence to our trading decisions.

12:25

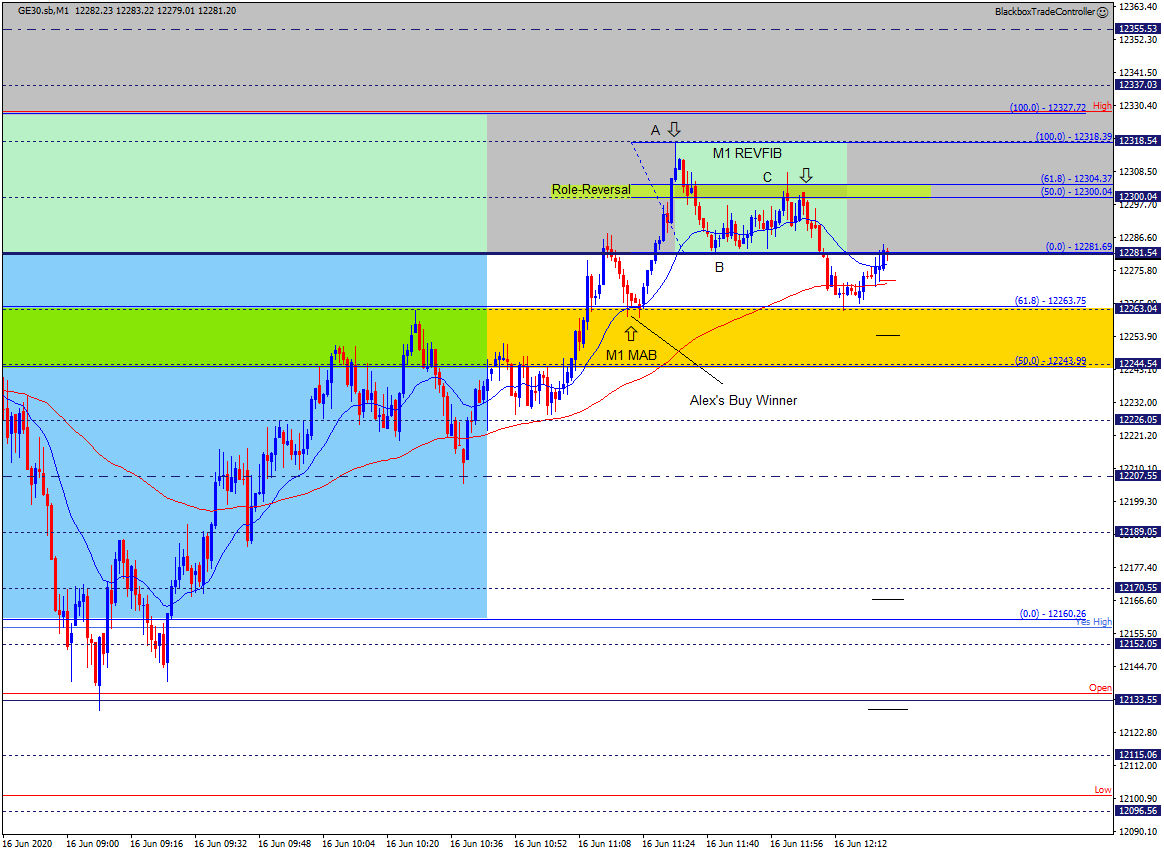
Great REVFIB following Alex’s M1 MAB Winner

After seeing Alex’s winning trade – see comment below – Elaine also identified it was followed by a great REVFIB sell after price failed to stay above the D1 EQZ@12281

Note that:

  • Point A is precisely on the Grid midline@12318
  • Point B is precisely on the Grid D1 EQZ@12281
  • Point C (50% level of GZ) is precisely on the Grid midline@12300

And finally, price then moved down to the M5 MAB and reversed back up off the Grid midline@12263, the 61.8 level of the earlier M15 Sell GZ.

Having such precise Grid structure does not guarantee success but it provides great guidance once mastered, that’s why we call it ‘The Holy Grid” 🙂


09:23

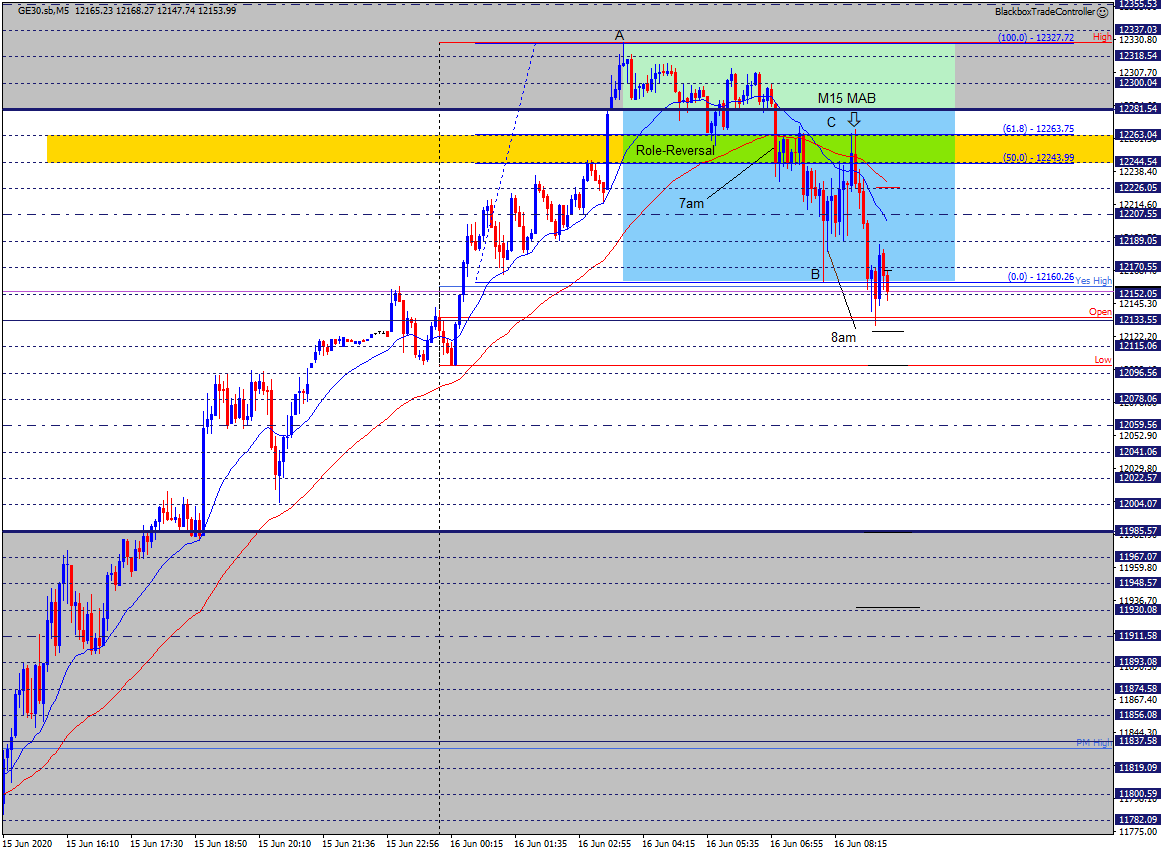
M15 Sell MAB at Precise Levels

I’ve just sat down to see this setup that took place at 8:35 am, another great example of how the updated Grid precisely captures price.

This is the M5 chart, it seems to work very well with the Grid as much of the M1 choppiness is smoothed out. Note the GZ between 12243.99 – 12263.75, it falls EXACTLY between two midlines of the Grid.

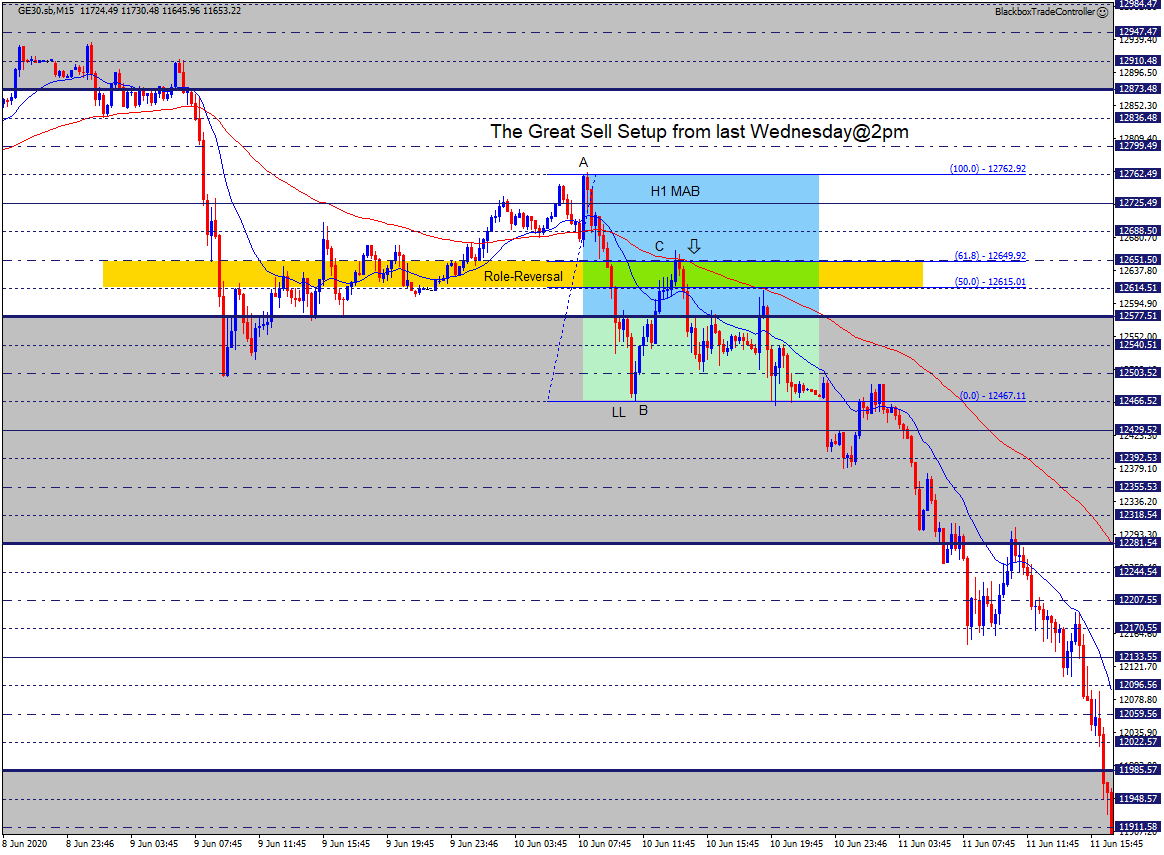
This is not a one-off!! I’m seeing it on other markets that I’ve applied the Grid to. Look at yesterday’s blog where I show the Grade A sell from Wed 10th at 2 pm – note the GZ!

If things go well today I will complete this phase of updates, meantime, if you want to use this Grid simply:

  • Load a new GE30.sb chart.
  • Right-click and select indicators.
  • Select bssConsole – Inputs.
  • Set Auto Update Channel Structure & Auto Update Equidistant Structure to true.

The horizontal Grid will automatically be overlaid, it will auto display the midlines based on the time frame you’re on. This can be overridden, I’ll cover that later.

Mon 15th Jun

Welcome to the daily DAX commentary where we share with members our unique take on Price Action as the session unfolds. We comment on trade setups that conform to our Trading Edge and how we use the hybrid Blackbox Trade Controller for MT4.

Use the comments section below to post questions and read what others are saying.

Remember to:

06:46

Software Updates

The above screenshot (M15 chart) shows the excellent sell setup that took place at 2 pm last Wednesday that both Elaine and Alex successfully took.

The update I’m working on will introduce something we’ve called the ‘Universal Price Action Grid’, it can be found on all markets and will look exactly the same.

Note how points A, B, and C all form at predefined levels on the Grid. Also, note how well the GZ (and the Role-Reversal) fall within two of the Grid levels (12651 and 12614).

Look closely at how well price interacts with the Grid levels.

(Note the following trade was taken on a demo account as I’m testing out the new environment).

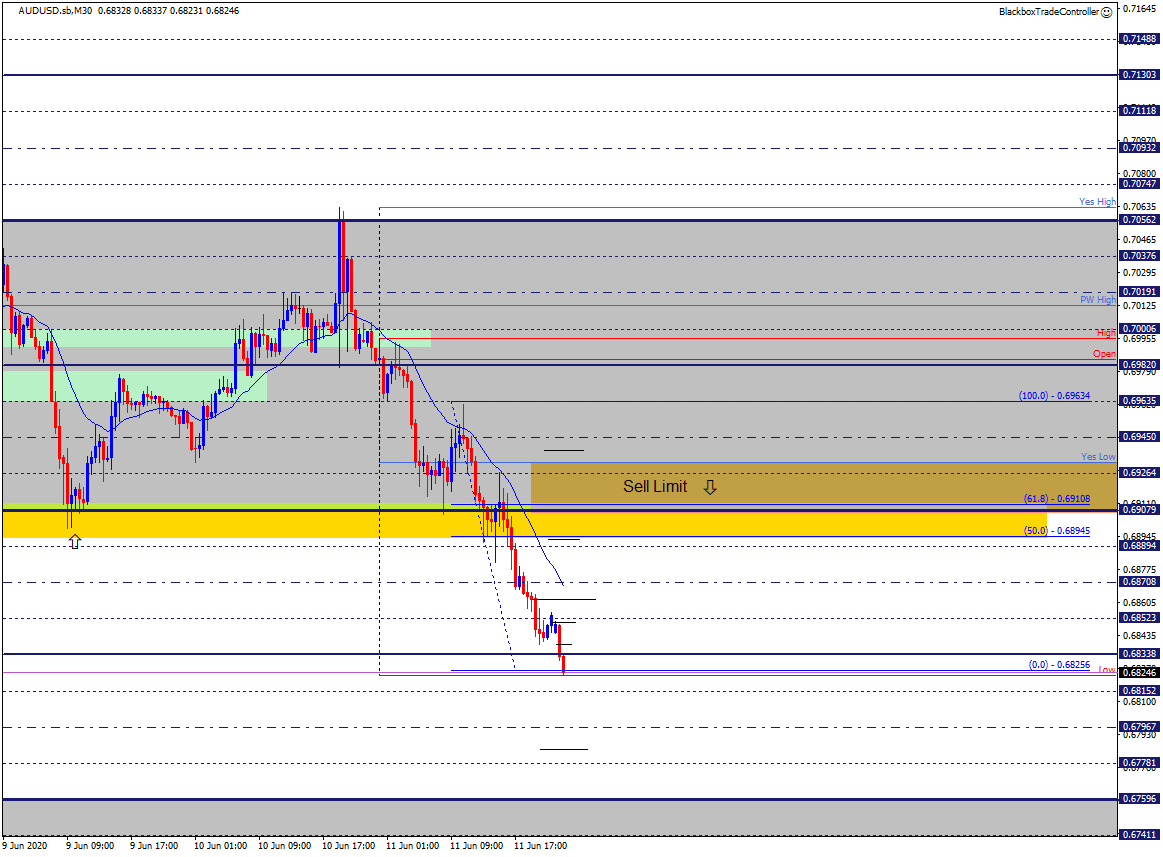
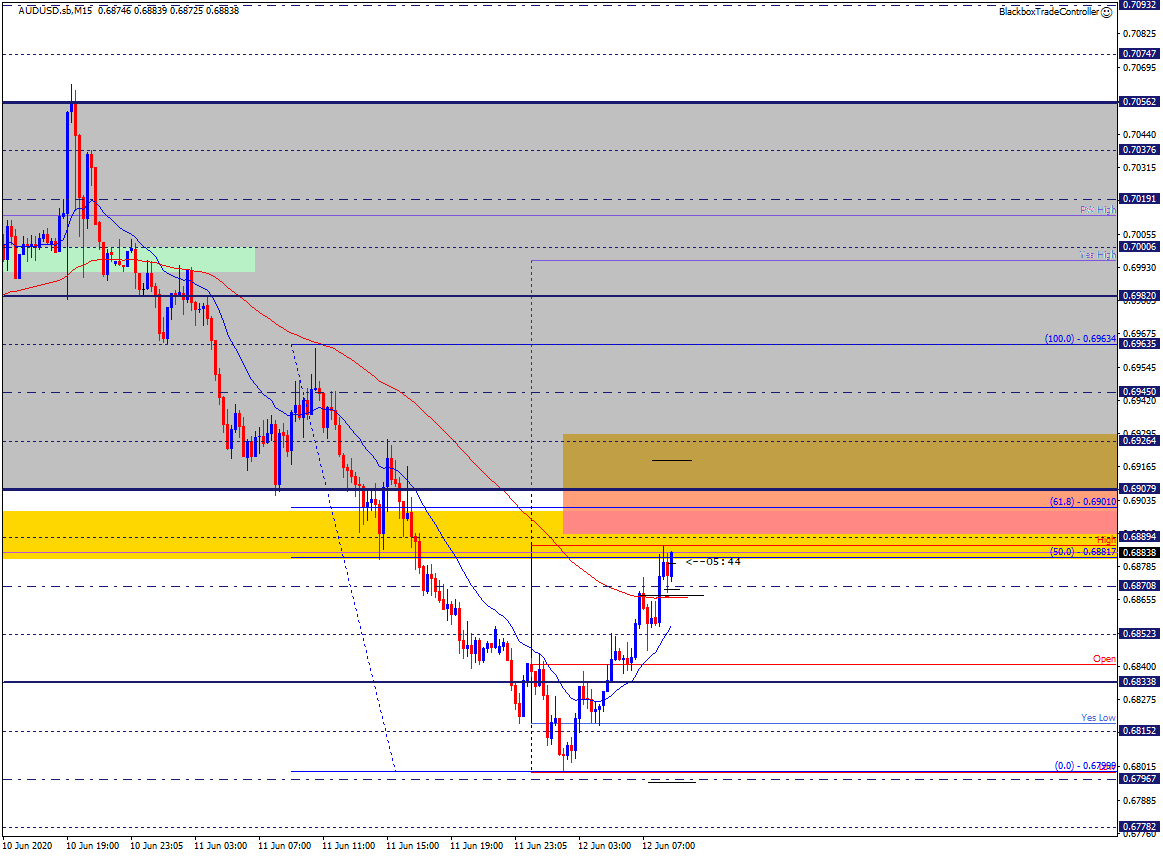
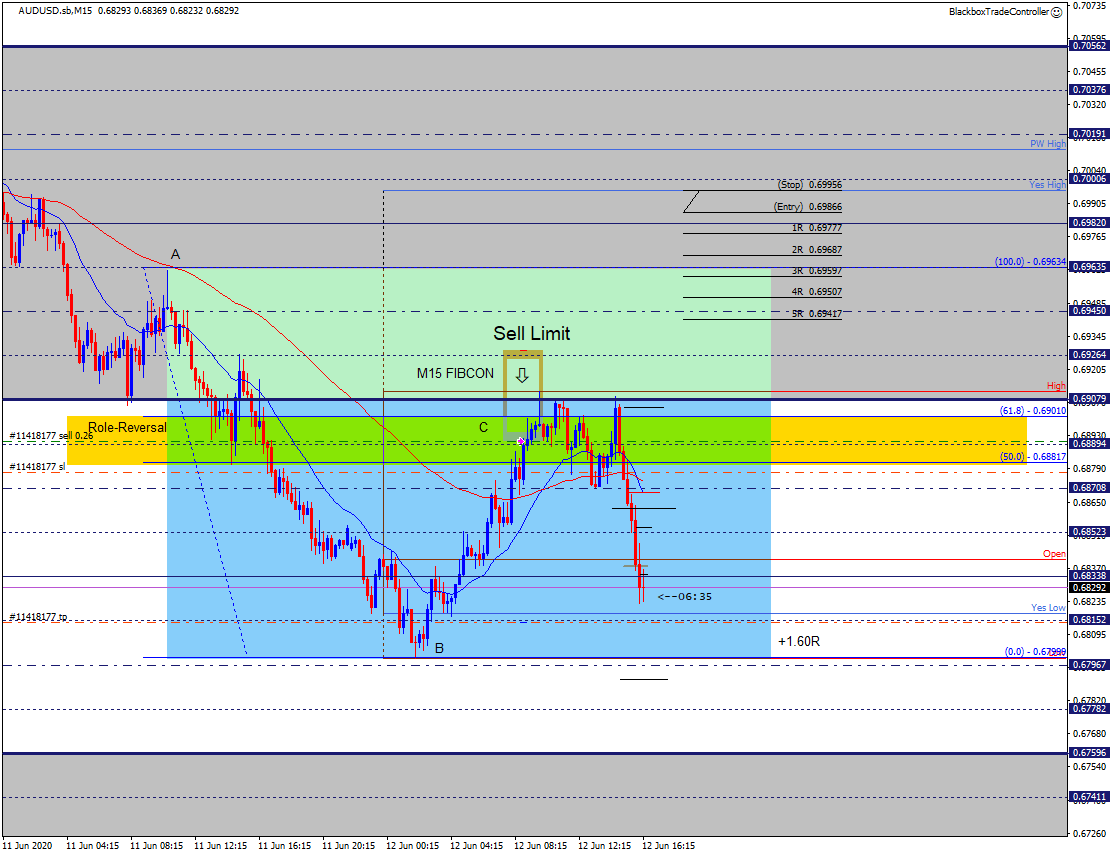
Whilst testing this on other charts late Thursday evening I spotted a sell setup on the AUDUSD M15 chart. I, therefore, set a Sell-Limit order to trigger if price retraced back up to point C overnight.

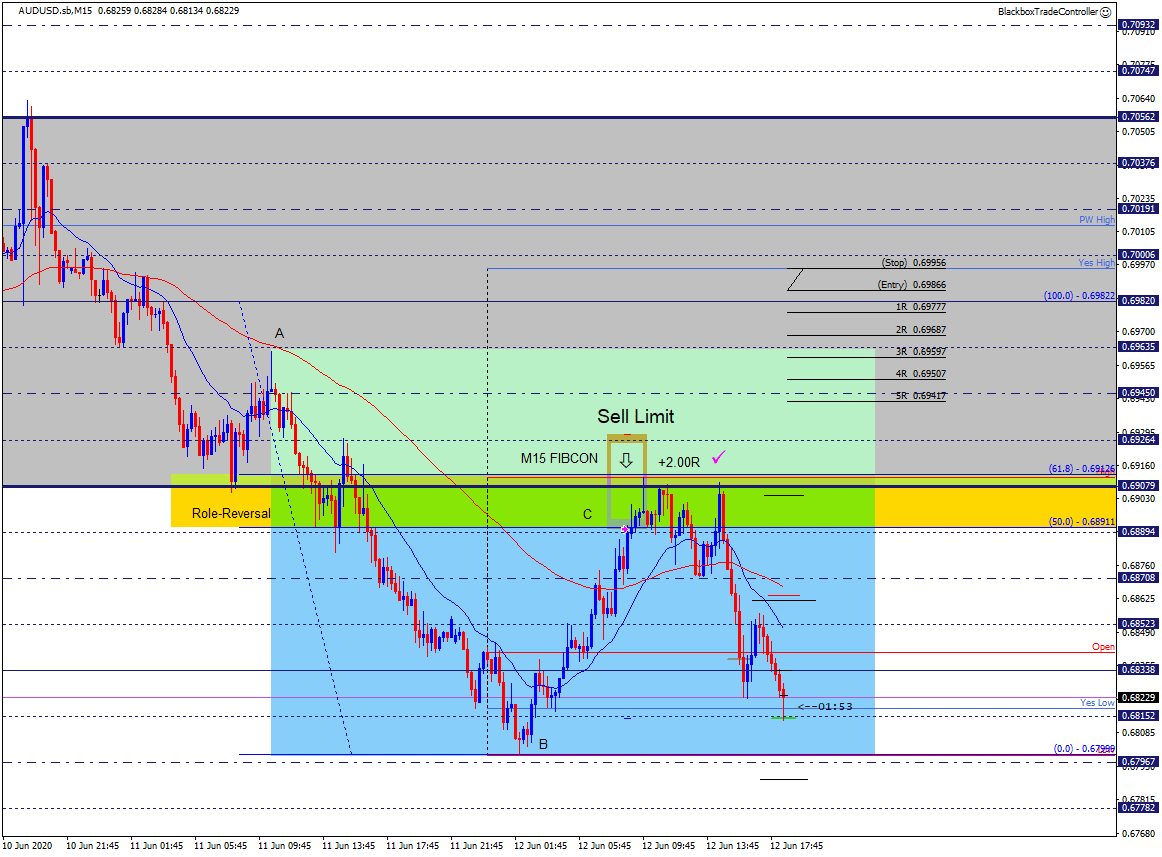
At 8:55 am Friday morning the trade triggered, 9 hours 43 mins later it closed out at 6:39 pm. Below are the screenshots I took.

What happened was that after overlaying the new Grid on different charts I began to forget what market I was looking at as I was seeing only patterns because each chart looked identical except for the price levels.

This is an exciting evolution of our Pure Price Action approach, I will continue to complete the software updates over the next few days.

The important thing to note as you look at the AUDUSD screenshots below is that the Grid looks exactly the same as on the DAX.

Also, note that these two setups can be anticipated well in advance and shared with the members 🙂

This screenshot shows the sell setup on the M30 chart late Thursday evening, point B was still forming and I really liked the GZ@0.69079

This screenshot shows the next morning, price has retraced back up to the GZ.

This shows the sell limit triggered and a sell trade entered at 8:55 am. Several hours later price finally moves down towards Yes Low with my target just below.

Note how price produces a Double-Top whilst trying and then failing to push above the D1 EQZ@0.69079

This shows the trade complete 🙂

Mon 15th June

End of Day Review

-2.22%

4 trades taken.

0 winners, 3 losers, 2 break even.

10:51

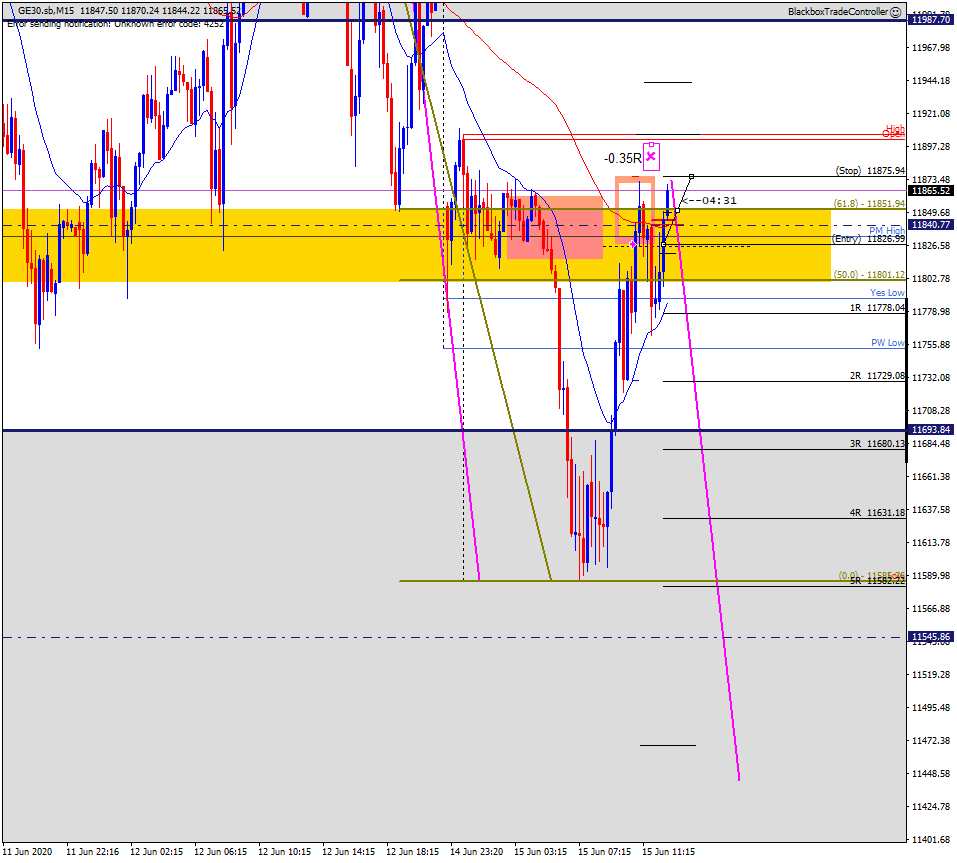
Failed H1 MAB | -0.35R

Price has beeen pretty much on a range after a sudden move up initiated around 9AM. 

I thought that the H1 would offer good resistance, but it wasn’t as effective as I anticipated. 

However, I was slightly above 1R at some point, but then price came back up to test previous highs. I locked profit initially on at the breakeven level, but then moved it to above PM High looking for some structure to aid me. It just didn’t work. 

13:06

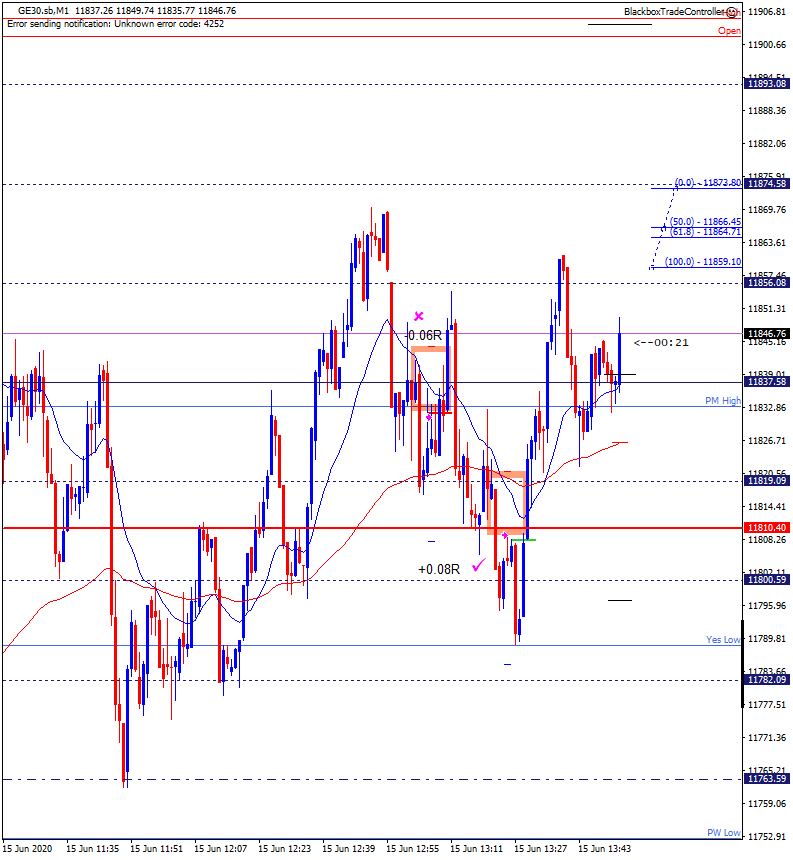
Price chasers trade | Breakeven +0.02R

Rule #1 is that we don’t know where price is going to go. However, sometimes I feel like there is pressure to go in a particular direction.

I feel that price really wants to move down, but I was clearly wrong on those trades. I managed to exit at breakeven levels to avoid damage, but they could have been two losers.

Let’s hope the bell in US brings us more action.

14:36

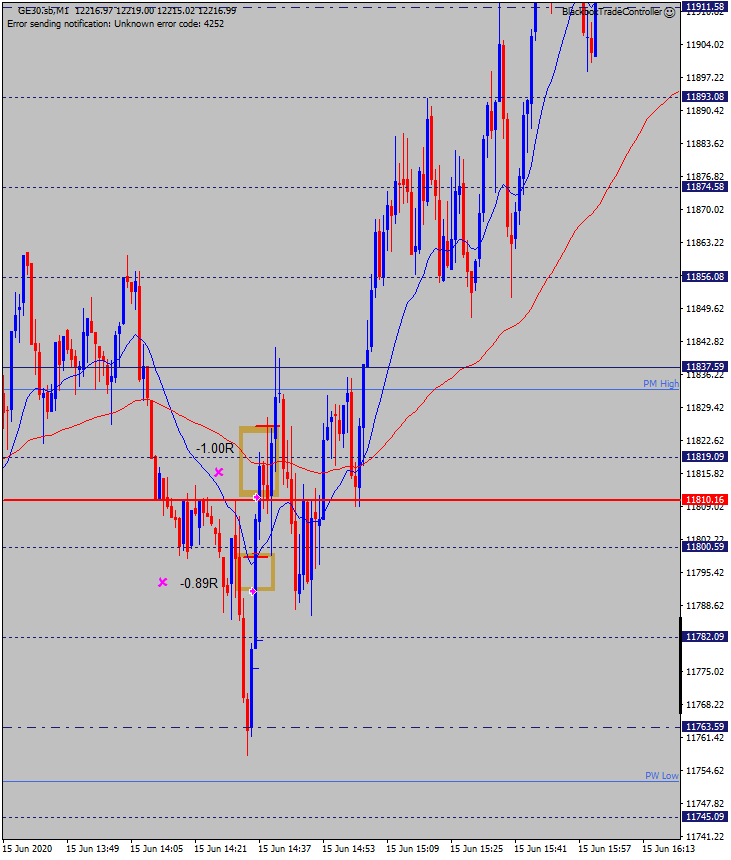
Failed M1 and M5 MAB | -1.89R

Certainly not the best way to finish my day. 

USA opened, price started moving very fast, and I made two poor decisions. 

Wouldn’t take them again, it shows how fast you can lose money in the market. 

Fri 12th Jun

Welcome to the daily DAX commentary where we share with members our unique take on Price Action as the session unfolds. We comment on trade setups that conform to our Trading Edge and how we use the hybrid Blackbox Trade Controller for MT4.

Use the comments section below to post questions and read what others are saying.

Remember to:

09:13

More Software Development

Wow, what a bearish day yesterday turned out to be!!

Of all the days to be working on software, however, the result will be something that I’m very excited about and will take our trading to another level, I look forward to sharing this with you next week.

So today I’ll be continuing to update the software, good luck trading!


Fri 12th June

End of Day Review

+1.51%

3 trades taken.

2 winners, 1 loser, 0 break even.

08:34

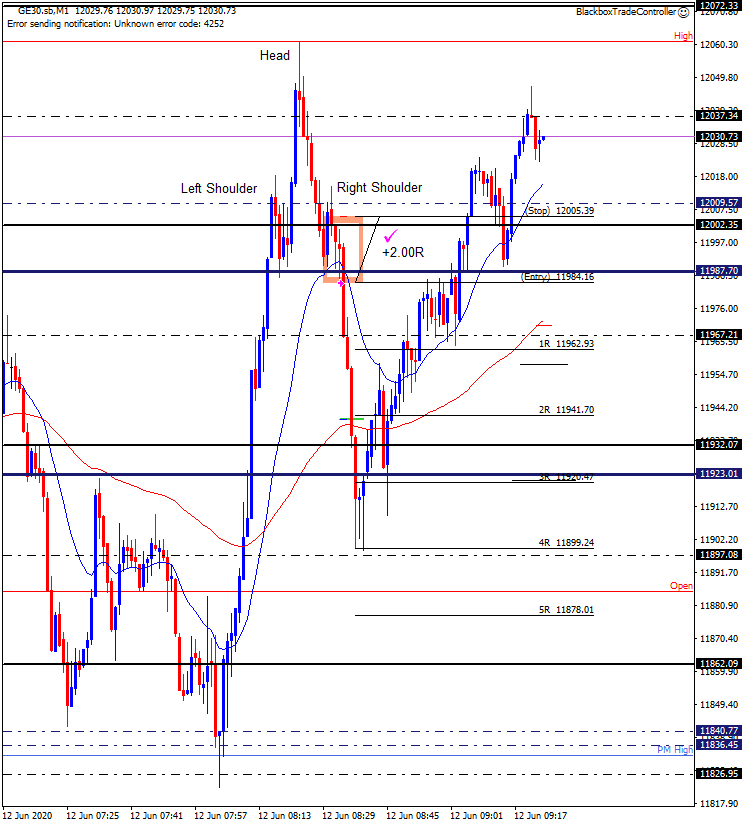
M1 Head and Shoulders | +2.00R

Nice little setup, once price broke down what was a resistance previously, I pulled the trigger for a quick 2R. 

08:55

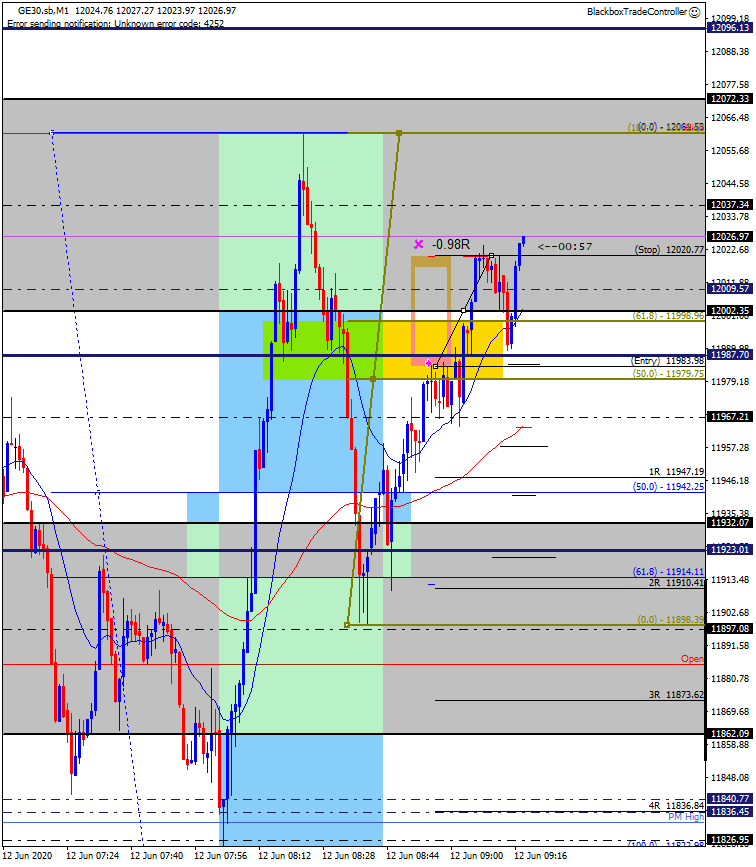
Failed M1 Reversal FIBCON | -0.98R

I will catch you one day, I promise! 

Bulls in control for now, let’s see where they drive price up to.

I am looking to sell near the 12135 level should price keep climbing.

In the meantime, any opinions as to why this trade shouldn’t have been placed? I am still happy with the trade though, but I want to refine my criteria selecting reversals.

09:50

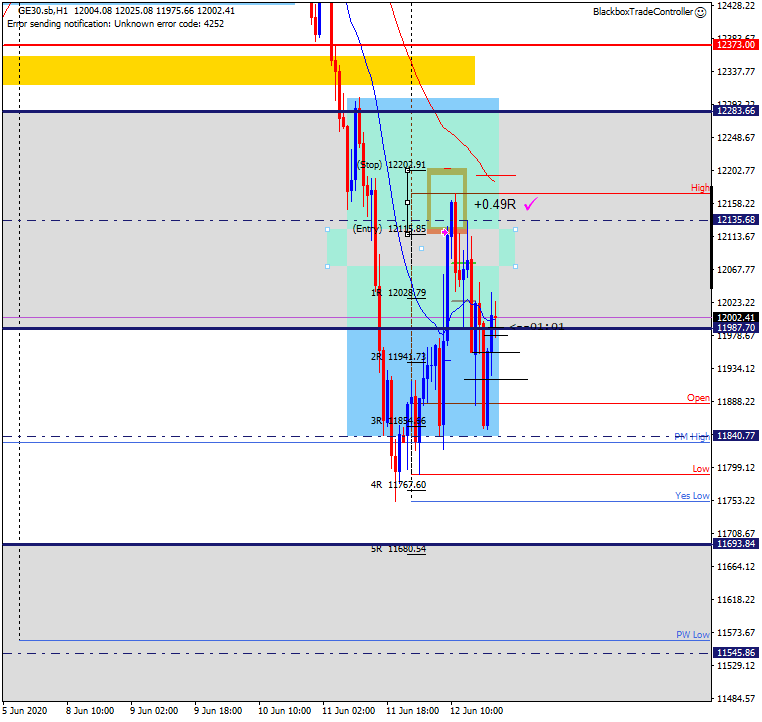
H1 FIBCON | +0.49R  – The power of structure!!

Don’t mind the R value, I had to leave after 3 hours and 57 minutes on the trade and therefore closed it out. I had to admit that when I closed it, I thought if I didn’t it was going to be a loser. 

Now, let’s focus on structure of the below screenshot. This is the kind of trades I should be taking every day. They seem to be the most reliable ones, regardless of how I then decide to manage it! 

Price seemed to be on a bullish session, but I was on sell mode given the Thursday action. The 12135 looked to attractive for a retracement, having role reversal and the Fibonacci levels as support. 

It was a long trade, but that is expected if you take it on the H1 chart as I did. Not every trade needs to be decided in 5 minutes, right? I am glad that I entered it, now it’s only a matter of managing it appropriately. 

Thu 11th June

End of Day Review

-1.35%

2 trades taken.

0 winners, 2 losers, 0 break even.

08:48

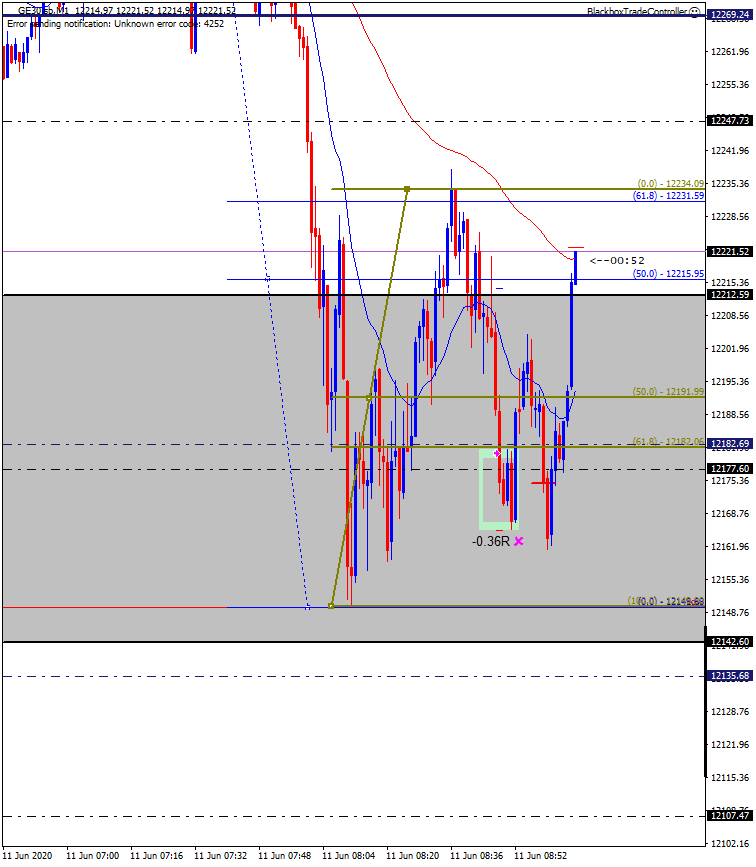
M1Reversal FIBCON | -0.36R

This one just didn’t work out, I guess it enters into the probabilities side of it. 

Note how price literally touched the bottom of my trade entry, I still can’t explain how it didn’t take me out.

When I saw buyers driving price up and price holding above my entry level, I felt there was enough buying power in the market to keep going.

That was partially true, but it only manifested itself after another test to the bottom of that range unfortunately. 

After being I’d say -0.99R, I could have taken profits when the trade became a 1R winner, but I really thought price was showing enough strength to continue up. 

11:19

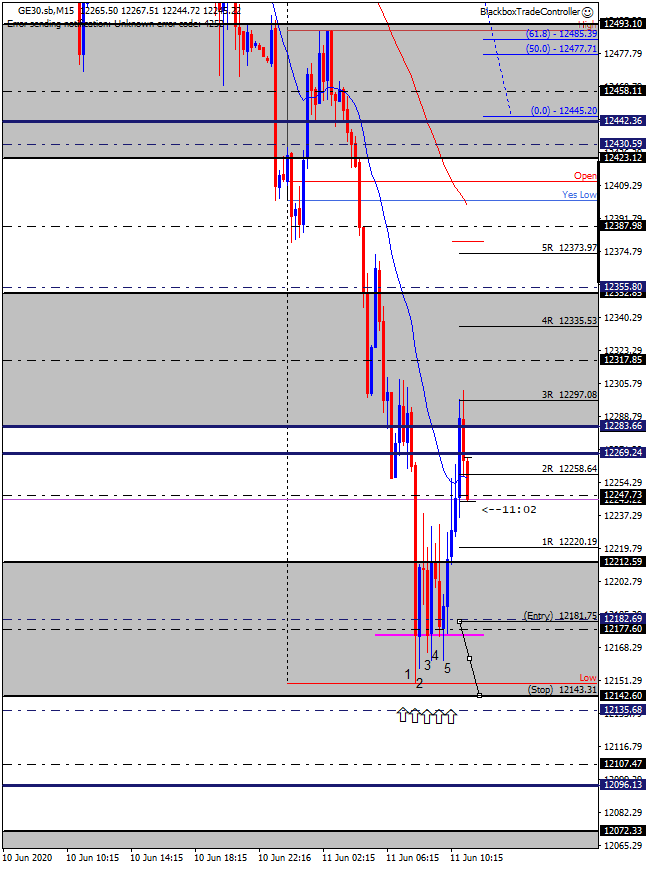
5 wicks pattern = BUY!

This is a structure I need to keep monitoring in order to trade it live. 2R were relatively easy to achieve even with a stop loss below the low of the day.