FIBCON Flowchart
As software engineers we are big fans of flowcharts. They are a vital tool used in the design phase since they force you to think in a logical, structured manner and to organize each step of the process in a sequential flow.
The FIBCON flowchart below is designed to nurture a structured way of thinking that will eventually, over time become ingrained and second nature.
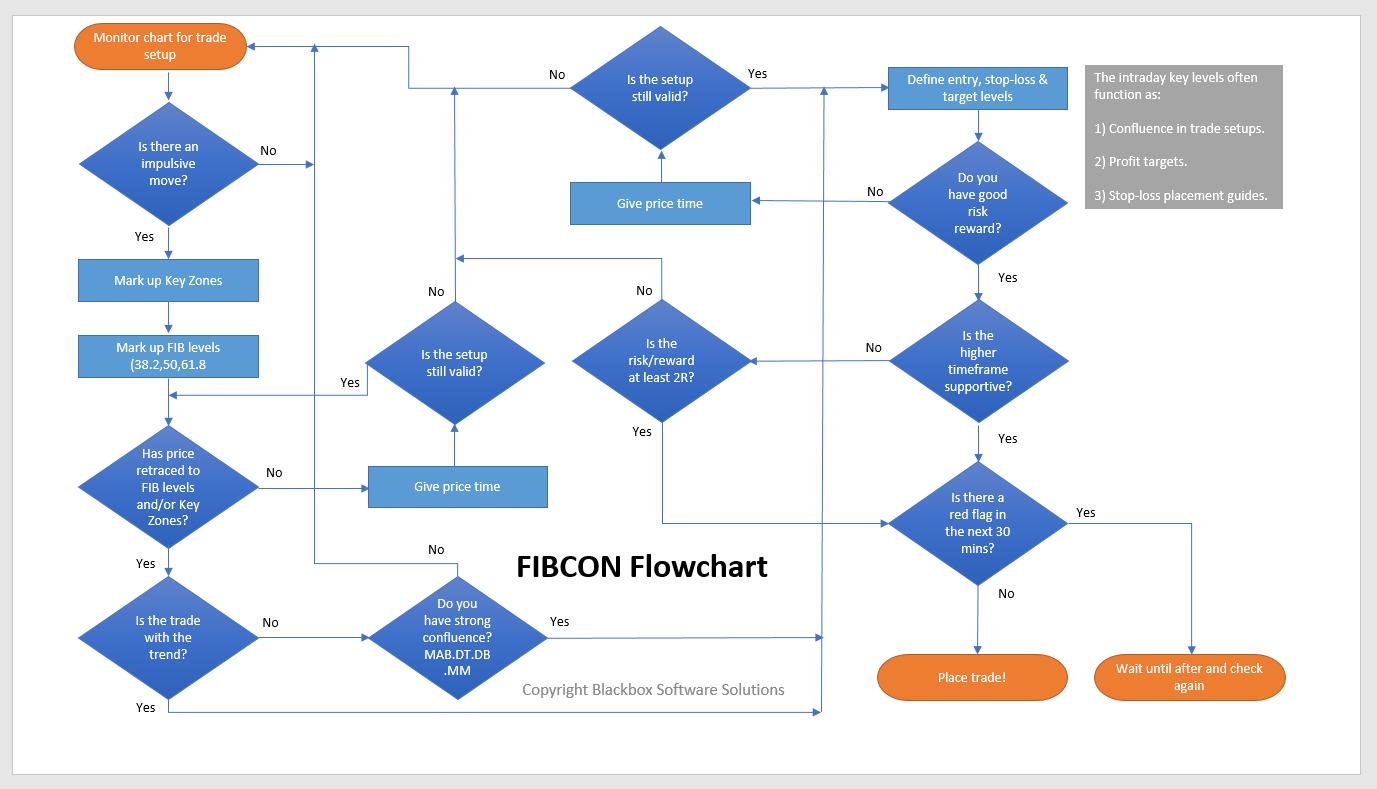
Let’s go through it starting at the top-left.
Monitor the charts for an impulsive move, until one forms there is no trade to consider. It should be clear and obvious.
The best one’s form a higher-high or lower-low that’s clear, stands out and looks good in the context of the time frame.
This is because each time frame has its own context, what that means is that the higher time frame context taken from the hourly chart might be it’s in an uptrend. However, the 5 minute chart might currently be in a downtrend. This downtrend on the 5 minute chart could be a corrective or B-C leg on the hourly. Understanding this concept is key when trading intraday and provides guidance to setting profit targets.
- When an impulsive move forms wait for it to end and reverse, when it does mark up any role-reversal zones along with the 38.2, 50.0 and 61.8 FIB levels.
When price retraces to these zones assess the structure as to whether the 38.2 level is as far as the corrective leg will reach or does it have potential to reach the 50.0 and 61.8 levels.
Experiment with the FIB levels using the key zones as described here to see if they line up with the 50.0 and 61.8 levels, if so watch them closely. Assessing the structure comes with experience but generally the greater the retrace the higher the probability and the greater the risk-reward or R potential.
To filter poor setups and develop discipline one rule a trader might apply is to not consider a trade until price reaches the ‘Golden Zone’, the 50-61.8 levels.
Sometimes the key zones and FIB levels complement each other perfectly, other times not so. However, if there are very clear and obvious role-reversal zones present, then they are the most likely areas price will respond to and therefore take precedence over the FIB levels.
Overlay the active channels of the Price Action Grid for additional guidance.
Trading with the trend is always the preferred method.
The reason for this is that you have order-flow on your side, trading counter-trend requires having very strong confluence and a lot of experience. Good counter-trend trades do occur but they should be left alone until the experience develops.
Use the Trade Tool to define the trade entry, stop-loss and profit target levels. The minimum target should be the level at which the impulsive move reversed at point B and ideally offer a 2R setup. If only a low R is available then wait until it improves or pass on the trade.
Assessing whether the higher time frame is supportive is very important. The reason being that a FIBCON offering a SELL trade on the 5 minute chart might also form in the zone where a BUY FIBCON is forming on the 1 hour chart.
See the Custom Setup section on how to display both lower and higher time frame structure.
This higher time frame context may mean you decide to take full profits instead of partial profits because the energy of the 1 hour FIBCON is stronger than the energy of the 5 minute FIBCON.
However if the higher time frame context supports the 5 minute trade such that they’re trending in the same direction it’s possible that the 5 minute setup could be the start of another higher time frame second leg or measured move resulting in a greater profit potential.
This is where the Price Action Grid plays a key role in maximizing the profit potential of trade setups.
Check there are no Red Flag news announcements in the next 30 minutes. If there are then wait until after and reassess the trade setup. If the setup is no longer valid then pass on the trade and wait for the next one.
The purpose of the flowchart is to nurture a structured way of thinking and reasoning during the learning phase. Depending on the specific market, time frame and context it should be flexible enough to not limit taking advantage of good setups when they form.
For example, when trading the 1 minute time frame on the DAX30 or UK100, if a good setup forms at 1.05pm and there is a USD red flag news announcement due at 1.30pm an experienced trader may still take the trade because they expect it to run its course by the time of the announcement.
However, if the trade formed on the EURUSD 15 minute time frame best practice would be to wait until after the announcement.