Welcome to the daily DAX commentary where we share with members our unique take on Price Action as the session unfolds. We comment on trade setups that conform to our Trading Edge and how we use the hybrid Blackbox Trade Controller for MT4.
Use the comments section below to post questions and read what others are saying.
Remember to:
- Follow your Trading Plan.
- Practice Visualization Techniques.
- Review and journal your trades at the end of each session.
- And above all else Be The Bear….

16:17
Today’s Video
13:25
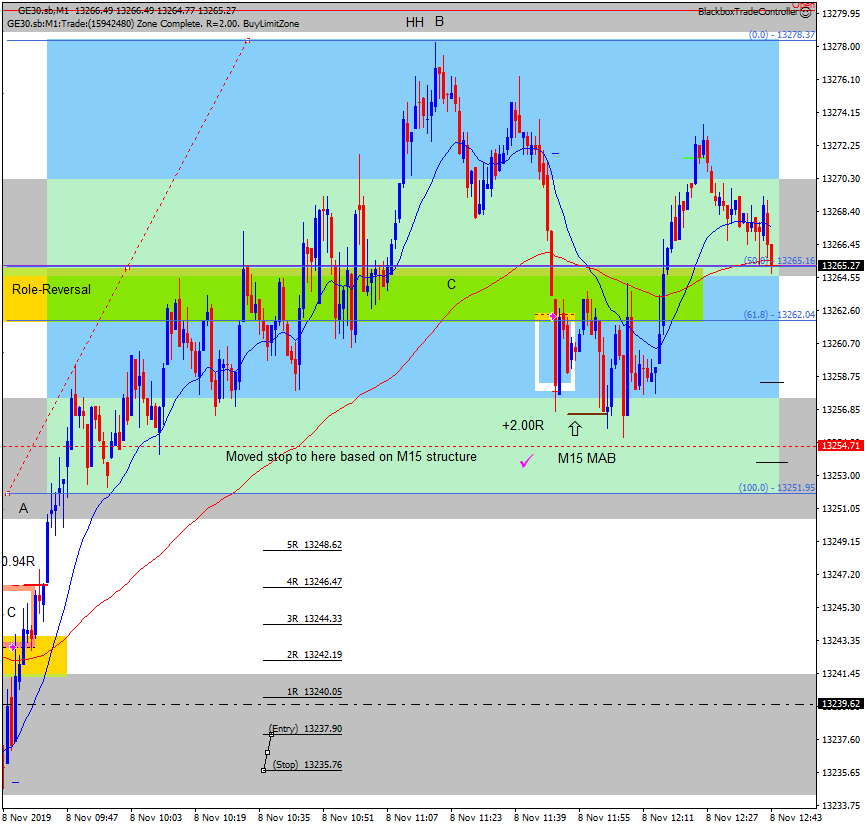
M15 Buy MAB Winner, +2.00R
This trade began as an M5 Buy MAB then turned into an M15 Buy MAB. I videoed it and was able to capture some interesting footage about my reasoning and why I justified moving my stop based on structure.
As a result of me adjusting the buy limit zone in real-time as price came down I ended up with my stop sat right on key RR structure. When I looked the M15 chart I was able to see how a small adjustment would protect it if the zone was going to hold.
This is the only time moving the stop is justified, when structure supports it!
On this occasion it worked out, all this is captured live.
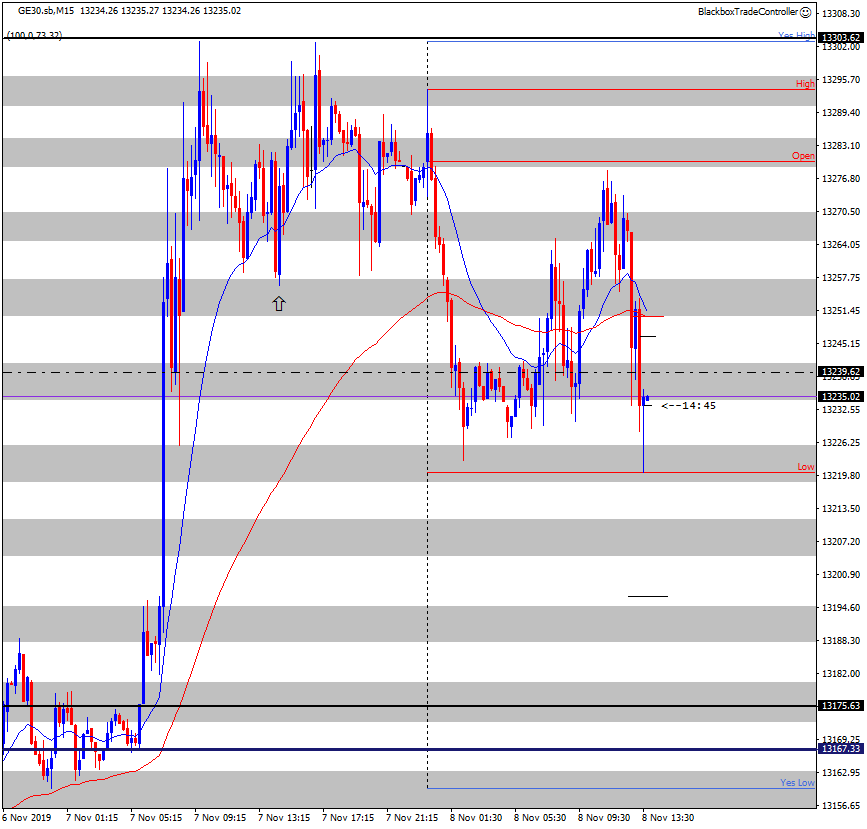
The M15 chart below shows the structure I used to adjust my stop so it was better protected.
12:56
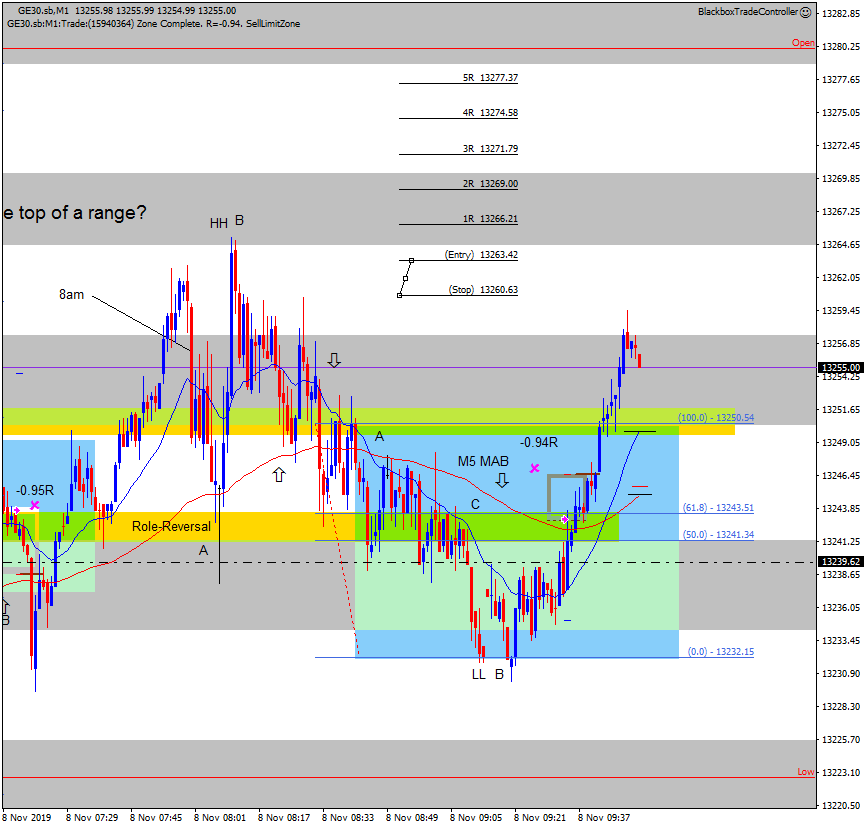
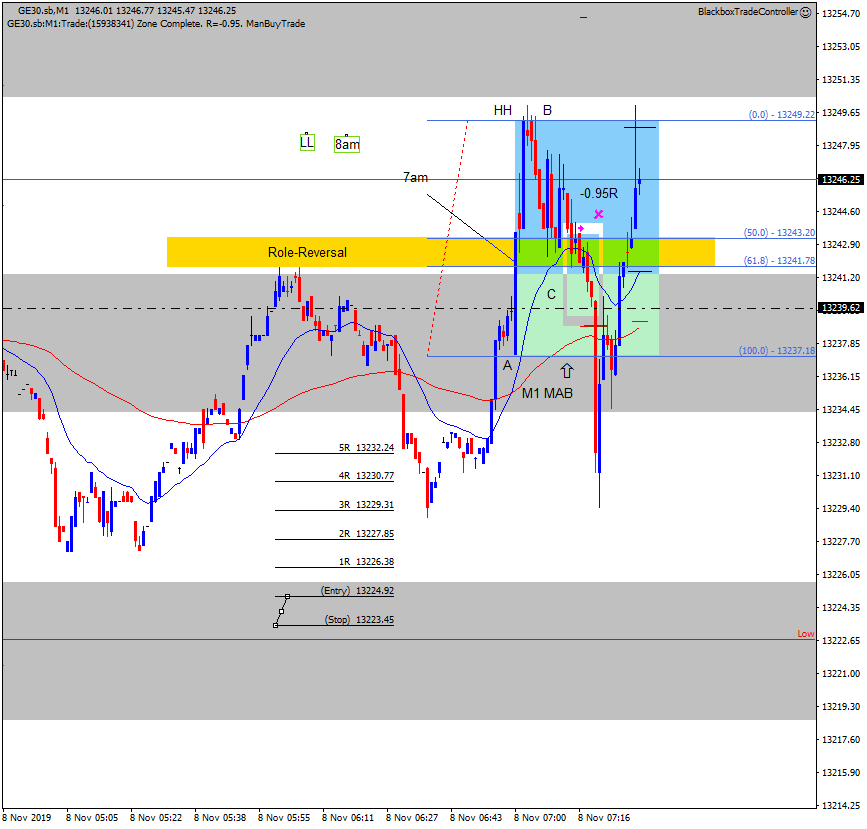
M1 Buy MAB Loser, -0.95R
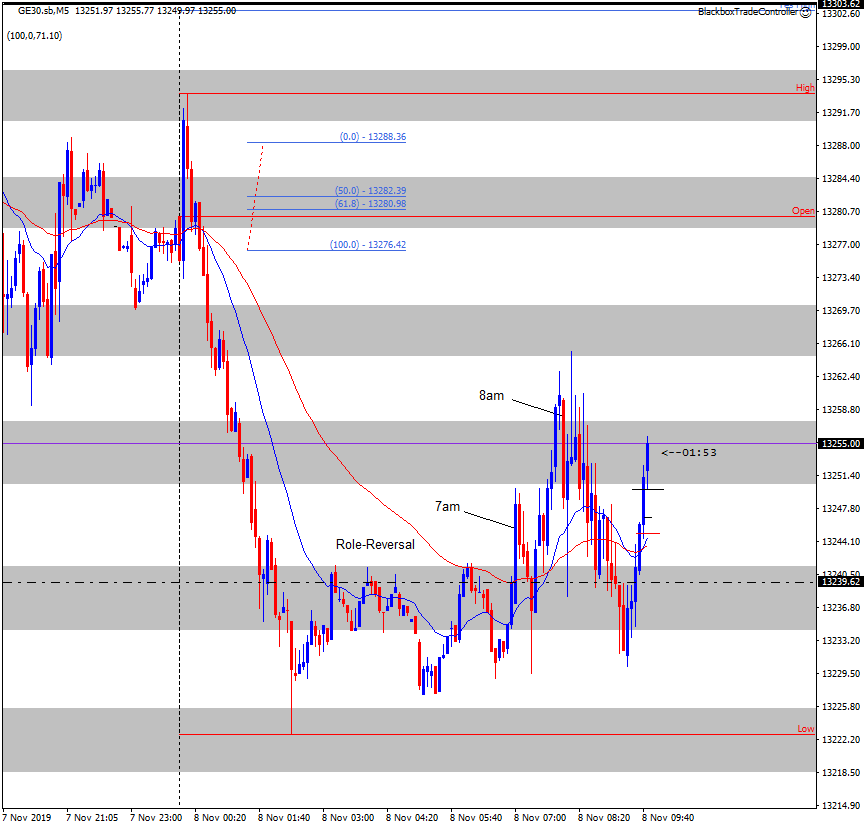
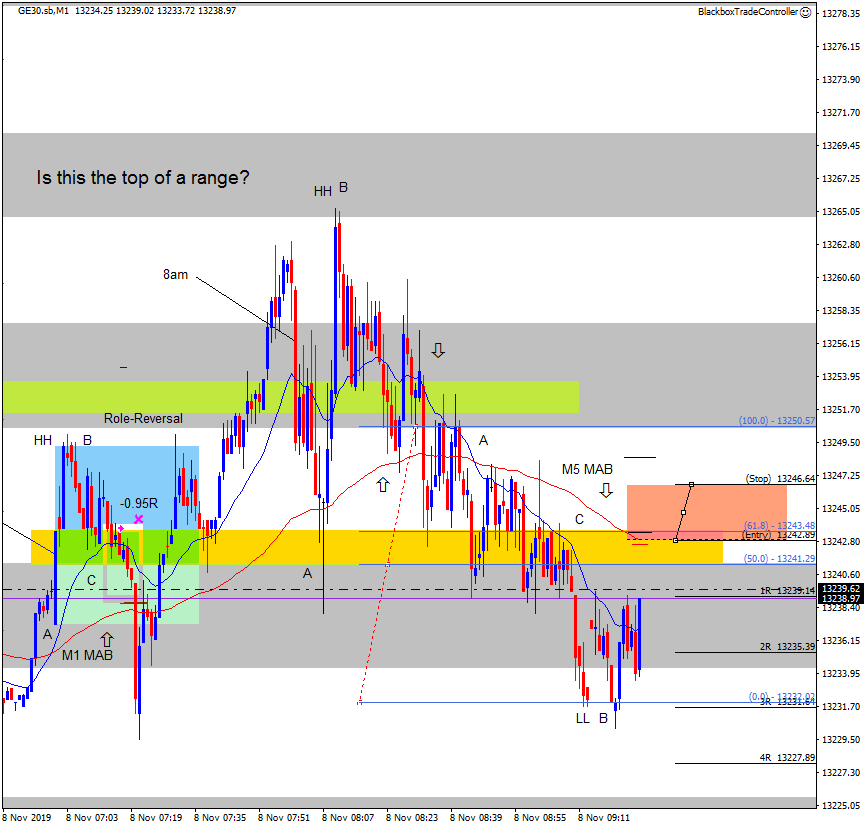
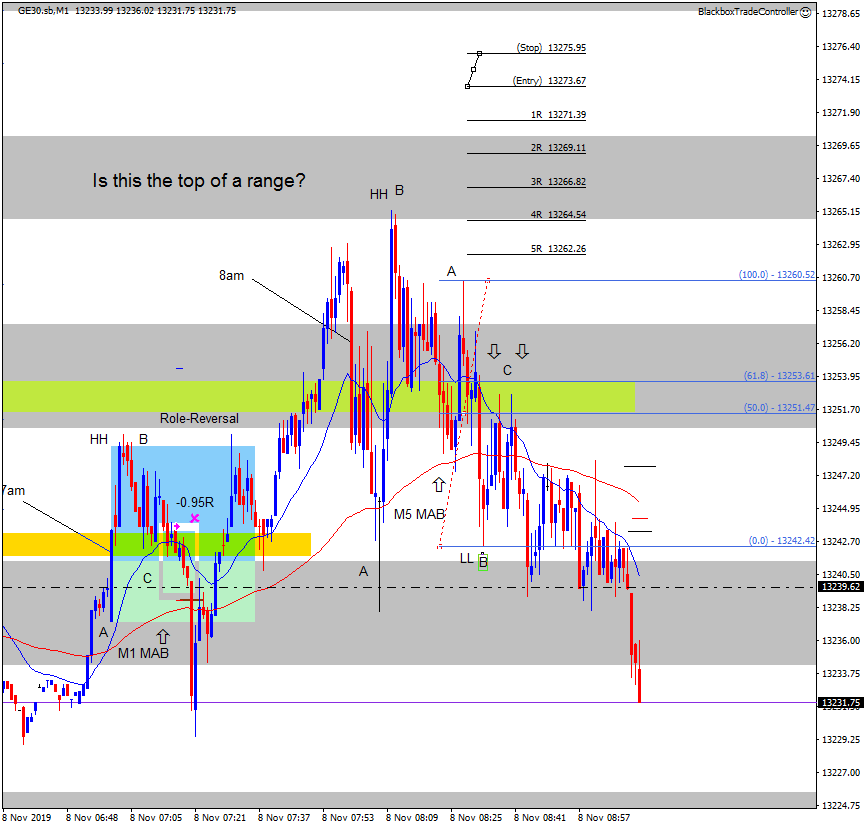
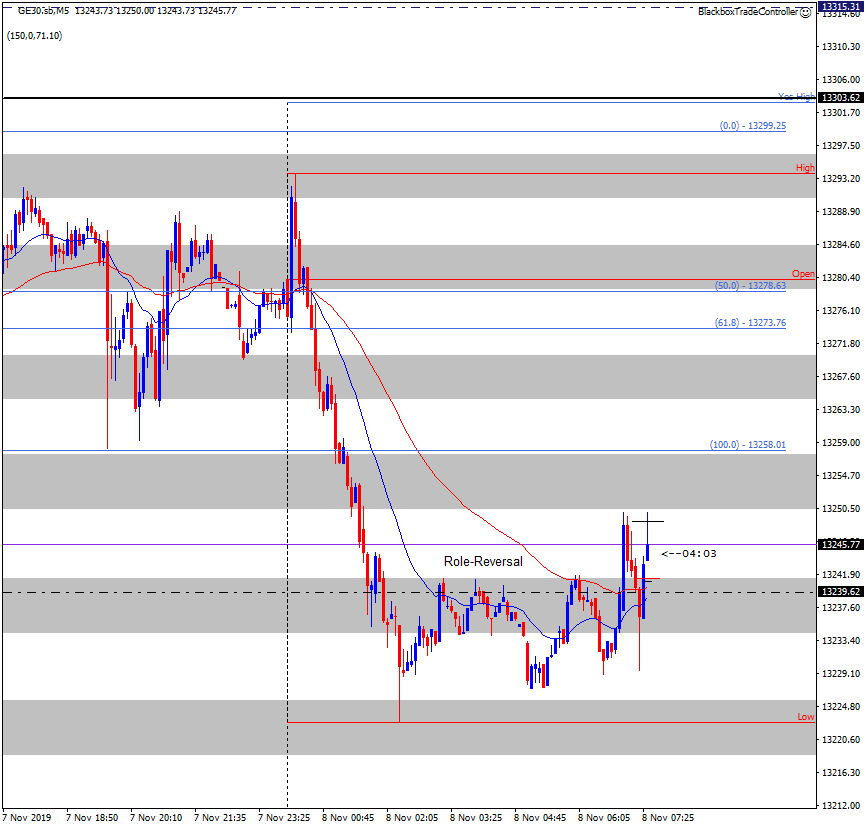
At 7am price moved up strongly to produce a HH and GZ as shown. I liked the buy setup due to the great RR – see M5 chart below – at the top of the KZ plus it was a buy trade.
I didn’t get the best entry but my stop was where I wanted it, however, price spiked down taking me out before moving on up. I’d take the trade again, it ticked all the boxes for me and is a great example of a ‘must take’ trade.
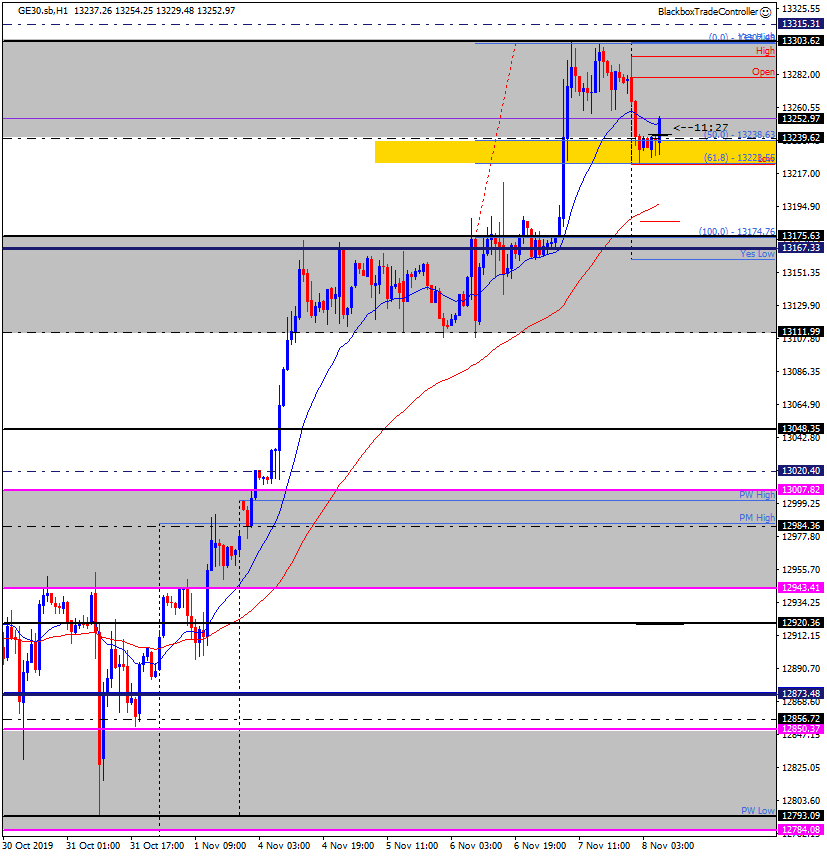
See the higher time frame charts below that supported the trade.
M5 and H1 charts below, note the RR structure on the M5 and the H1.
12:45
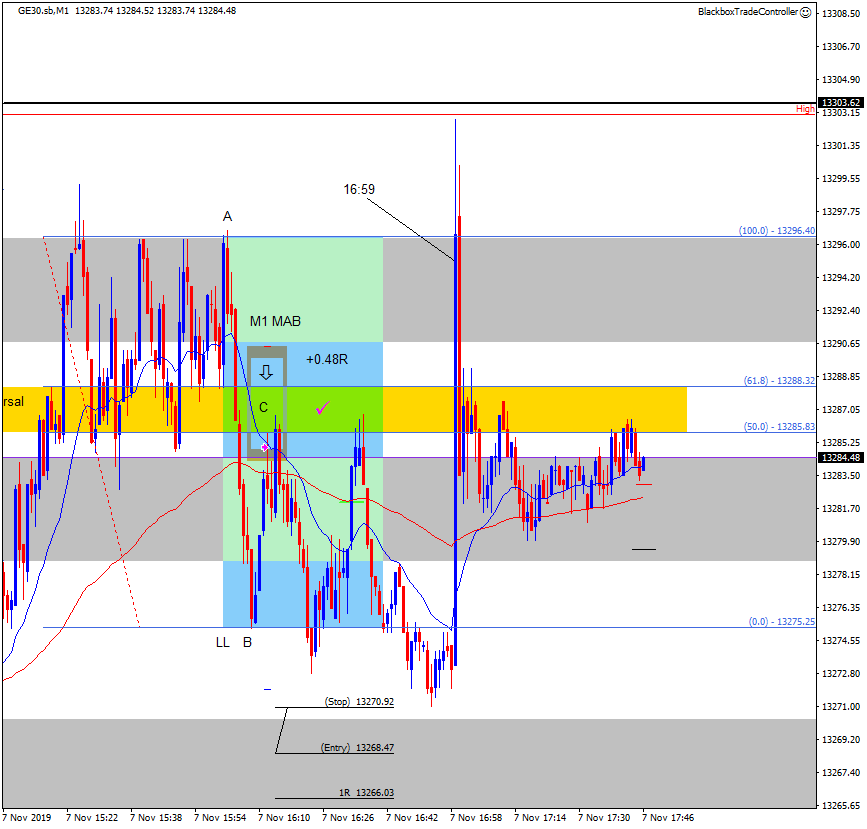
Small winner from yesterday, +0.48R
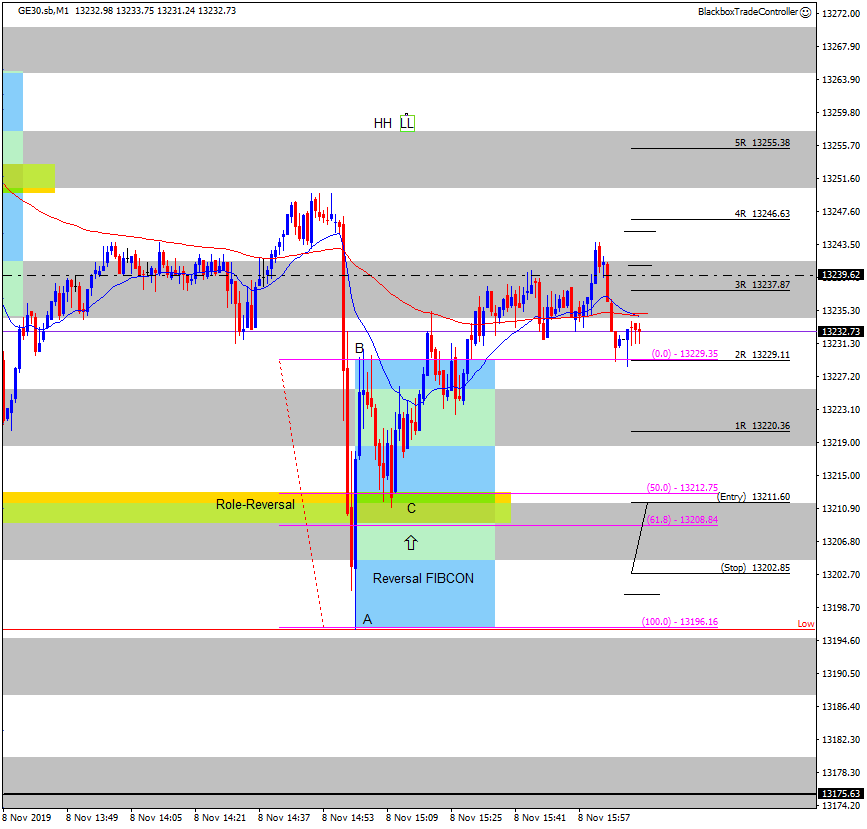
I returned to my desk yesterday afternoon and spotted this sell setup when price made a new LL. I was generous with my stop which meant my target was below point B. I trailed my stop and ended up with a small winner.
It ended up being a “Double Sell Golden Zone” that I failed to spot in real-time 🙁
Note the 16:59 bull spike that shot up to test the session stopping just short of it.

