Tuesday 31st
16:32
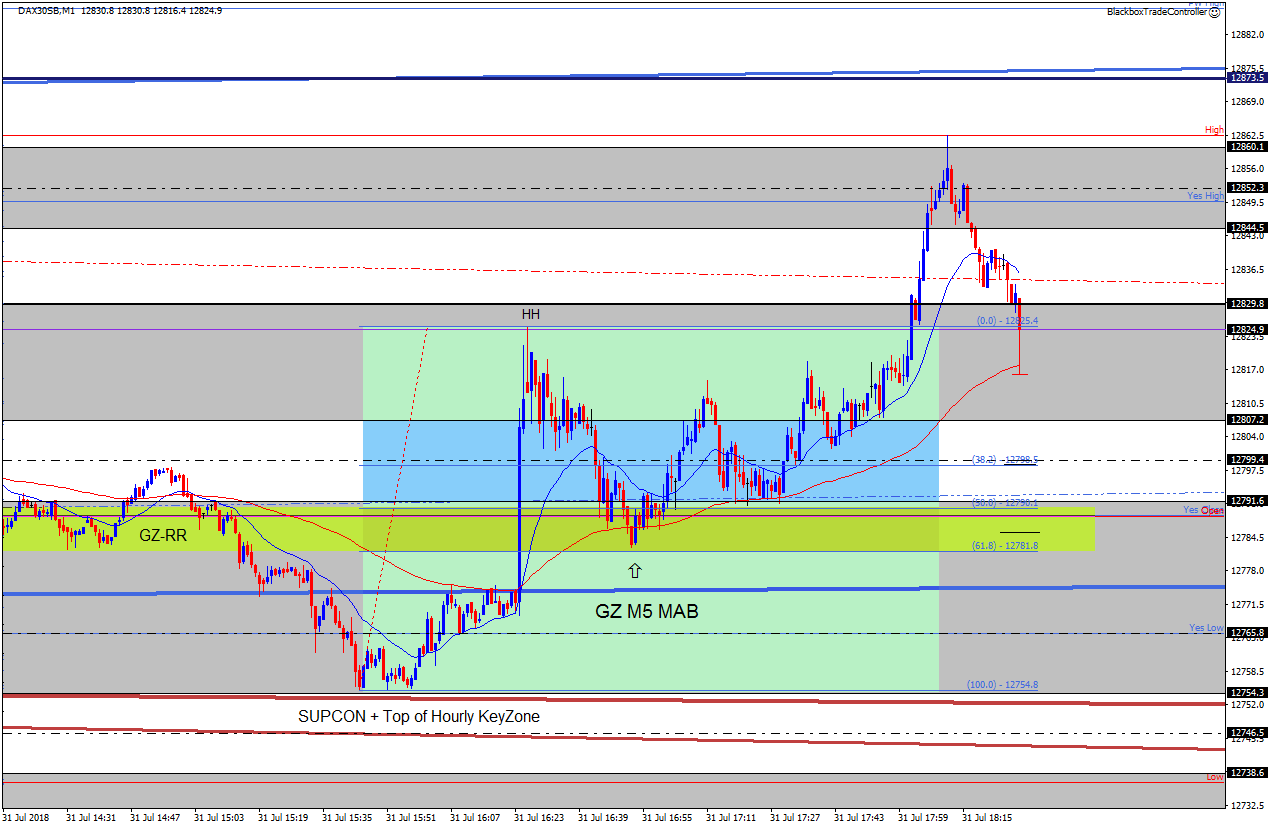
GZ M5 MAB after the US Open
I had to go out for a few hours and returned to see that price eventually moved down to test the area of SUPCON again, in fact it touched the top of the hourly zone mentioned earlier precisely (12753.3).
It then spiked up strongly at 14:24 to produce a HH setting up a decent M5 MAB upon the retrace down to the Open. The GZ had good RR structure when looking-left and with the stop covering the 61.8 level at 12781.8 would have resulted in a winner.
10:25
The importance of marking up structure
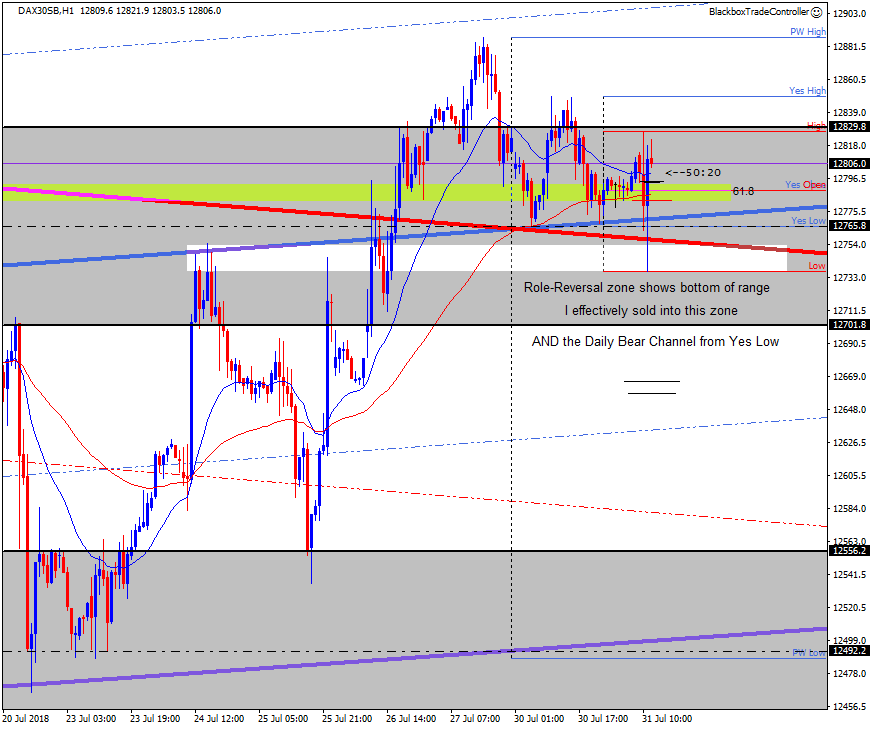
I’ve been looking at what else could have helped me avoid taking the earlier sell. I’ve already noted it was an area of SUPCON (Daily & Hourly Bear Channels) I was selling into.
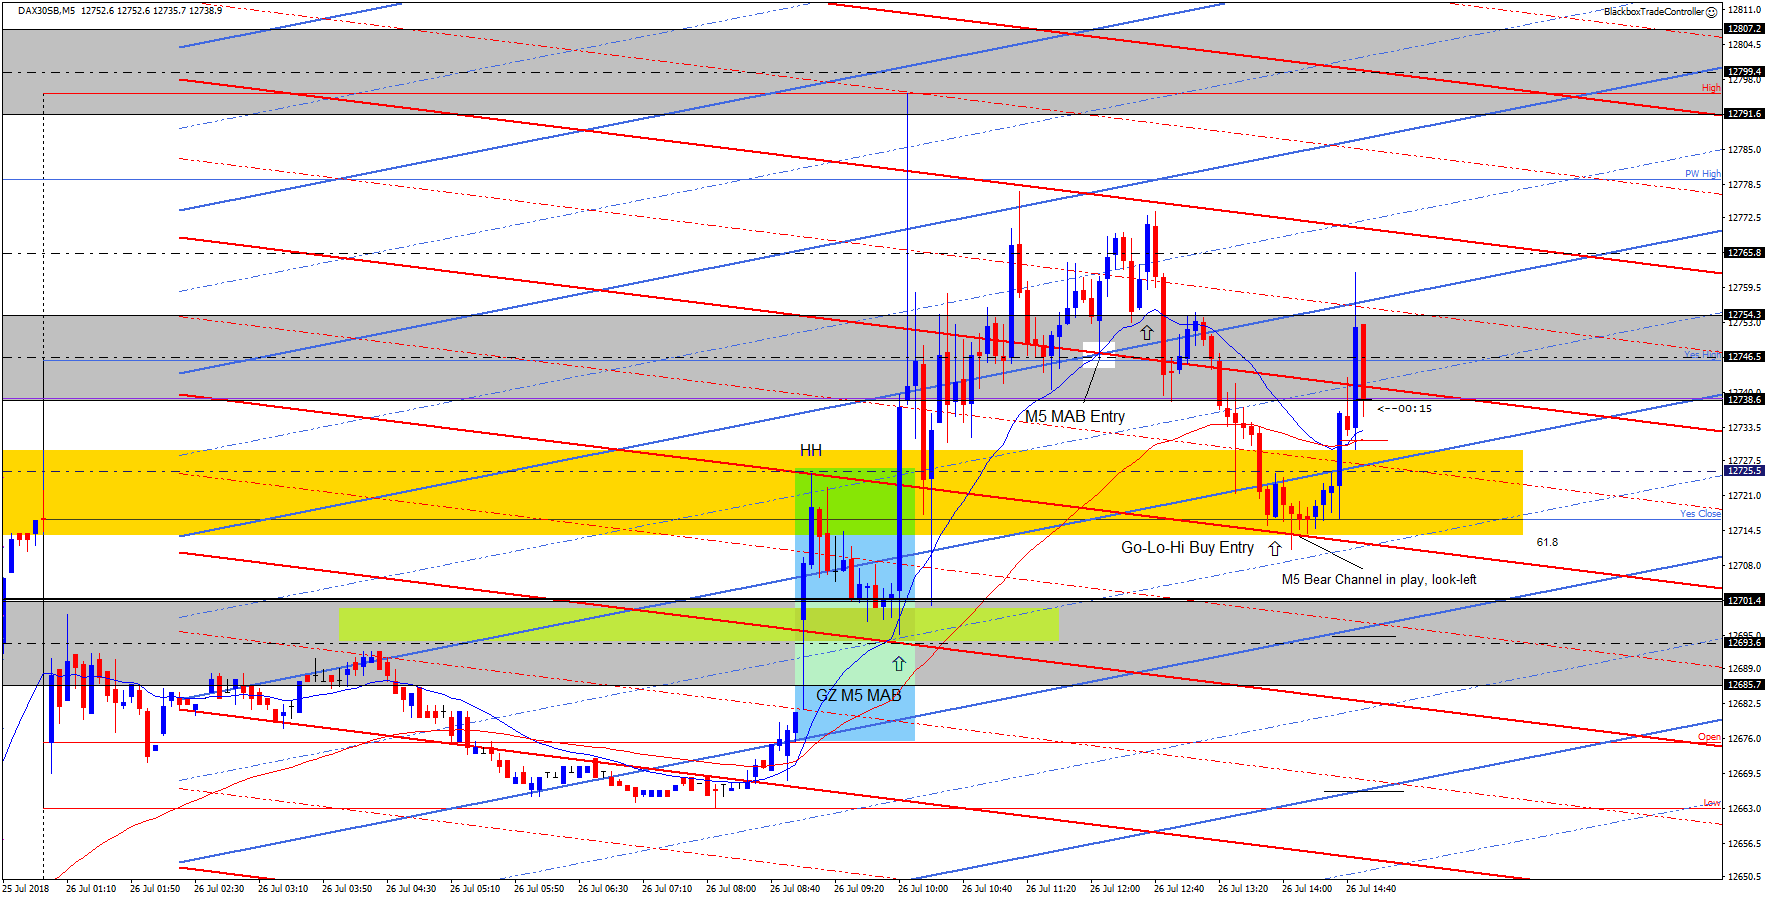
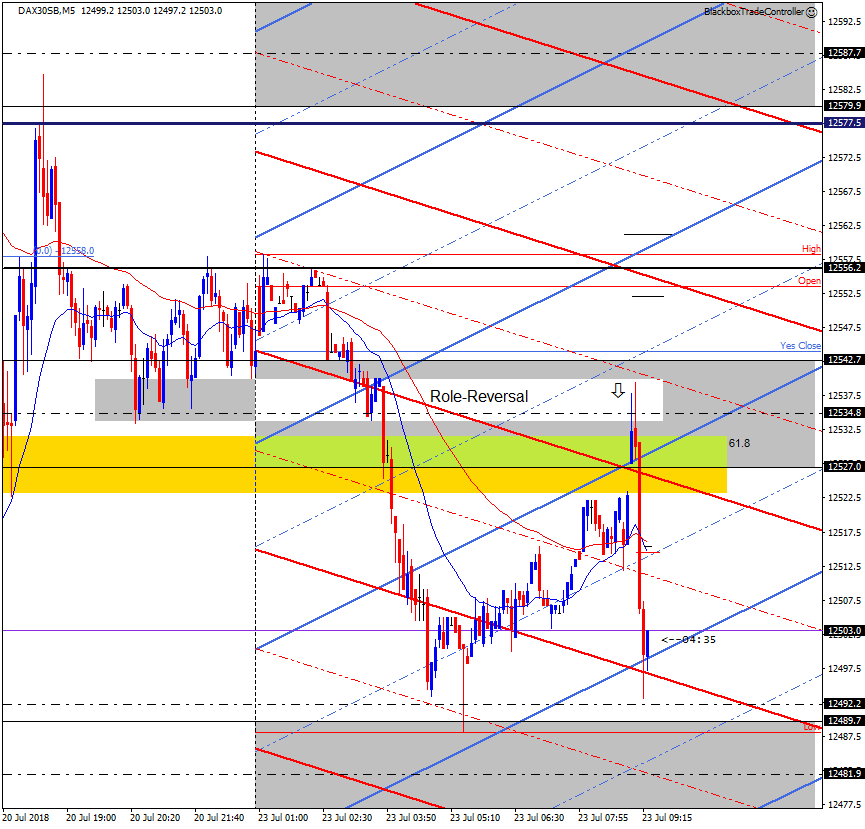
However, I had also failed to mark up a very important Role-Reversal zone on the hourly chart (above) that price reached the bottom of – pip perfect – to set the session low before reversing back up.
I have the hourly and 15 min charts on permanent display on a second install of MT4 dedicated to the higher timeframes. I’d failed to follow my plan and keep it up to date.
I’ve since marked it up and look how clear it is!!
Had I marked up such an important zone I’m sure I would have talked myself out of the trade and maybe even looked for a buy.
Also note that the bottom of the hourly zone is confluent with the bottom of the 5 min EQZ at 12738.6 so whilst the sell setup was structurally good the context was NOT!!
Easy afterwards of course but this is the level of analysis we have to step up to if we’re going to master this.
The core structure overlaid by the Price Action Grid captures most of the key decision points price makes as it moves up and down but we also need to add zones like these as and when required.
Note: The previous GZ M1 FIBCON I passed on was much better value because at that point price was still on it’s way down to the zone and price had paused at Yes Low.
Still no guarantee it would break below Yes Low but if you’d had the zone marked up on the hourly chart you might have reasoned price might be targeting the zone.
The DAX is a VERY technical market and likes to target key zones and levels, this can be seen when trading day after day.
If these areas are not accurately marked up it’s like wandering through a minefield!!
09:41
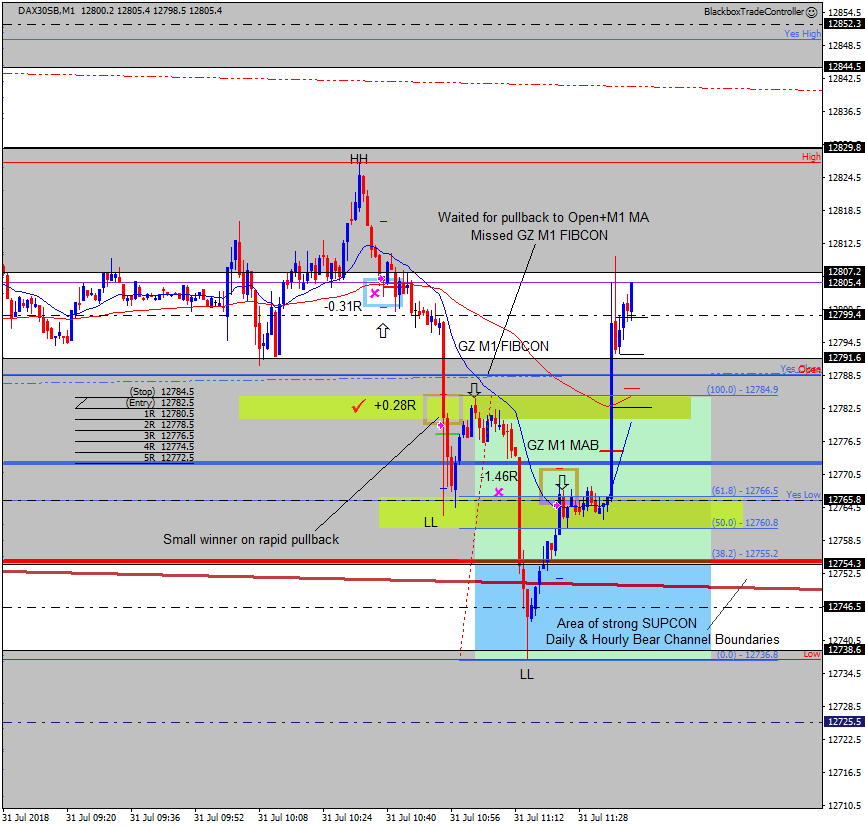
GZ M1 MAB Sell Loser -1.46R
Wow!!!
I didn’t move my stop but once Yes Low gave way the pressure resulted in a -1.46R loser 🙁
Structurally the setup was good BUT the context was it was reversing off an area of strong SUPCON in the form of the Daily and Hourly bear channel boundaries.
I still took it, probably because of FOMO after missing the great GZ FIBCON earlier.
I would not take it again!!
I’ve passed on these before, should have done the same with this one.
09:32
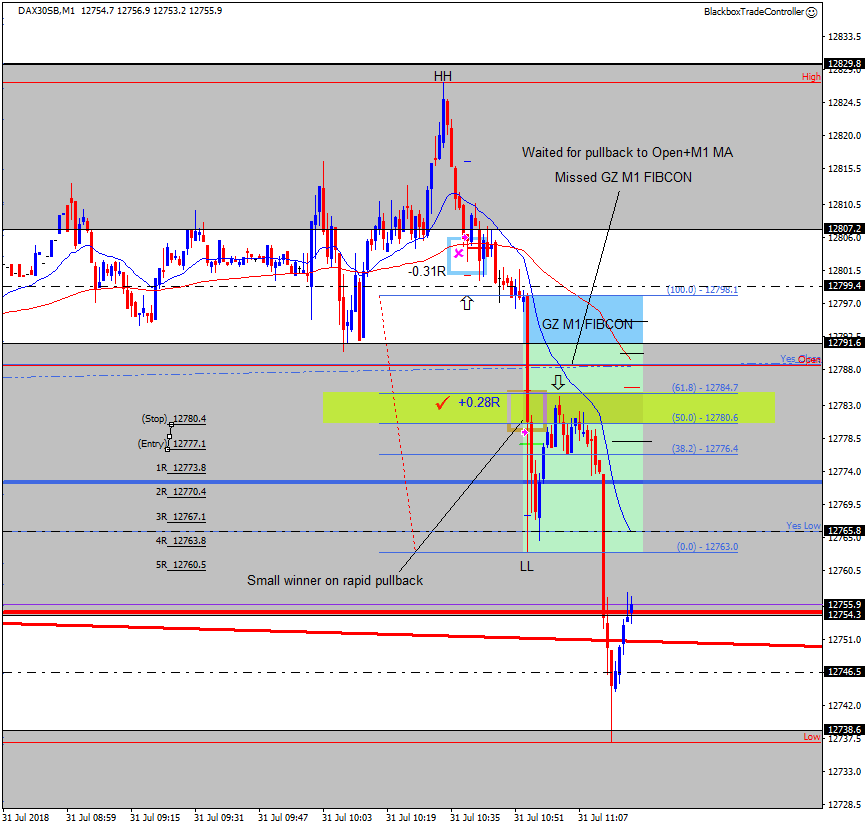
Sell Winner +0.28R, missed great M1 sell FIBCON
Price spiked down strongly and I found myself chasing it on a very rapid pullback. I glanced quicky at the 15 min chart to see a level that I entered at. I closed out after realzing that was not good practice, however, had I left it alone the 2R would have come in, typical!
A GZ M1 FIBCON then followed that I passed on as I was waiting for price to reach the Open and the M1 MA.
08:50
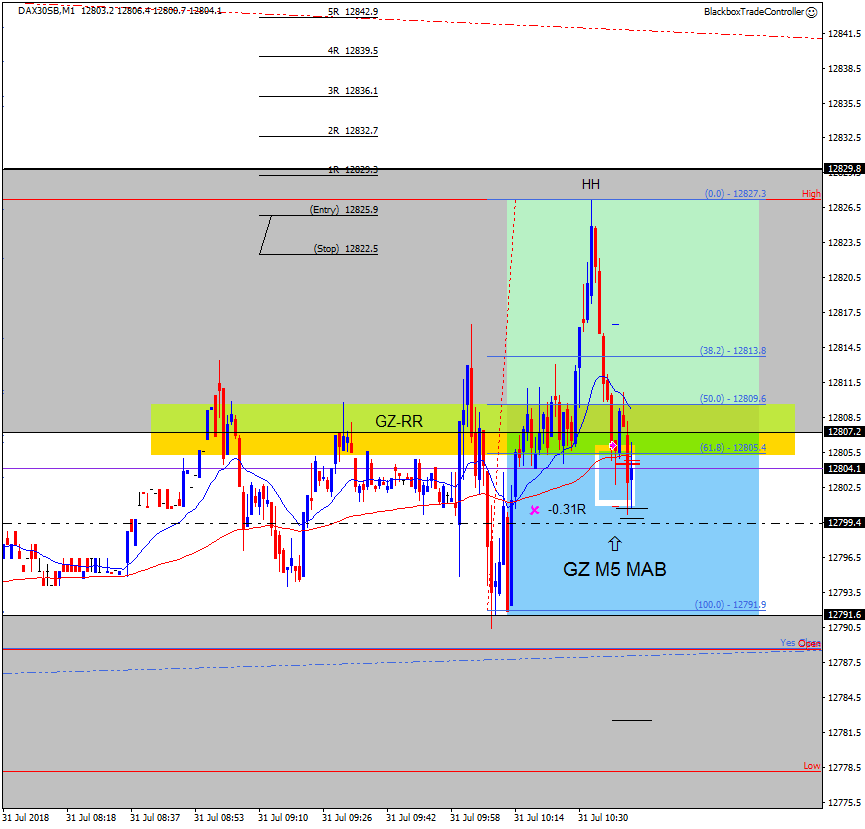
GZ M5 MAB Buy Loser -0.31R
I closed out after price failed to move back up, in time to avoid the full 1R loser.
The risk was that we’re in yet another range period, plenty of them lately! However, structurally I liked it, the Golden Zone had decent RR when looking-left.
It started off well reaching +0.88R then reversed quickly so I closed out.
Monday 30th
15:15
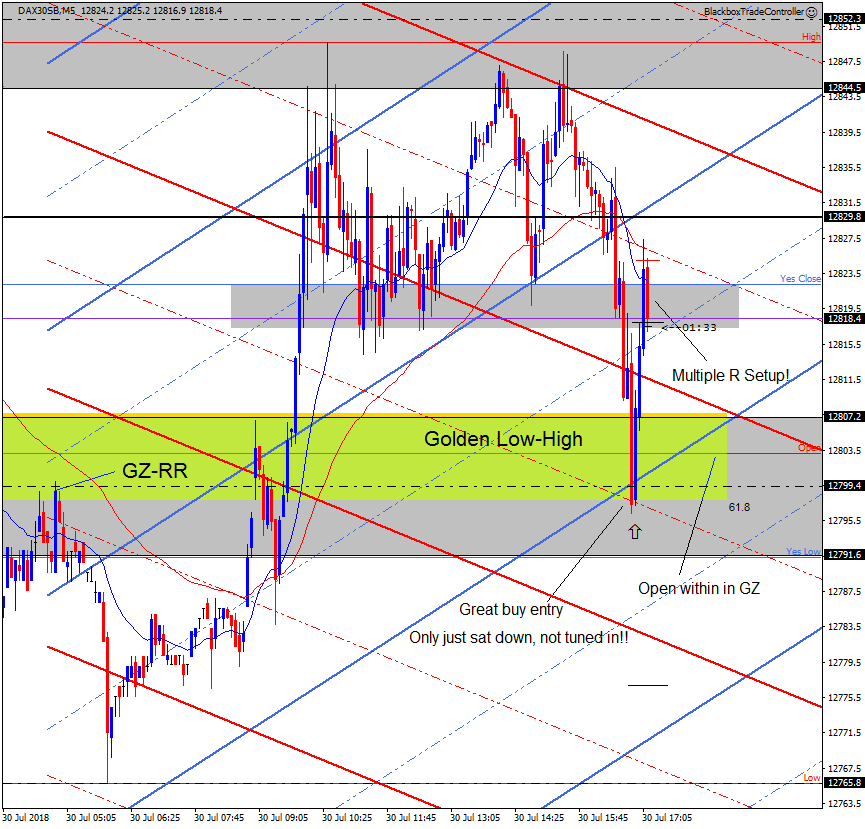
Golden Low-High Buy Setup
Feeling a bit frustrated!!
After having to leave my desk for a few hours I returned about 14:45 to see price making its way down into the Golden Low-High zone. I was close to taking the trade at the bottom of the zone zone as marked up but passed because I didn’t feel tuned in to the price action and have a “rule” to not rush into trades.
However, on this occasion it would have worked out as price reversed precisely where it should have if this was a text book setup – which it was!
Trade entry was supported by:
- The M5 bull and bear channel intersection
- The 12800 level (M5 EQZ mid-line)
- Good Role-Reversal zone, look-left
- 61.8 level of the zone
- Open within the zone
Despite feeling frustrated about missing such a superb setup it’s great to see yet another session Golden FIBCON play out in real-time instead of after the event 🙂
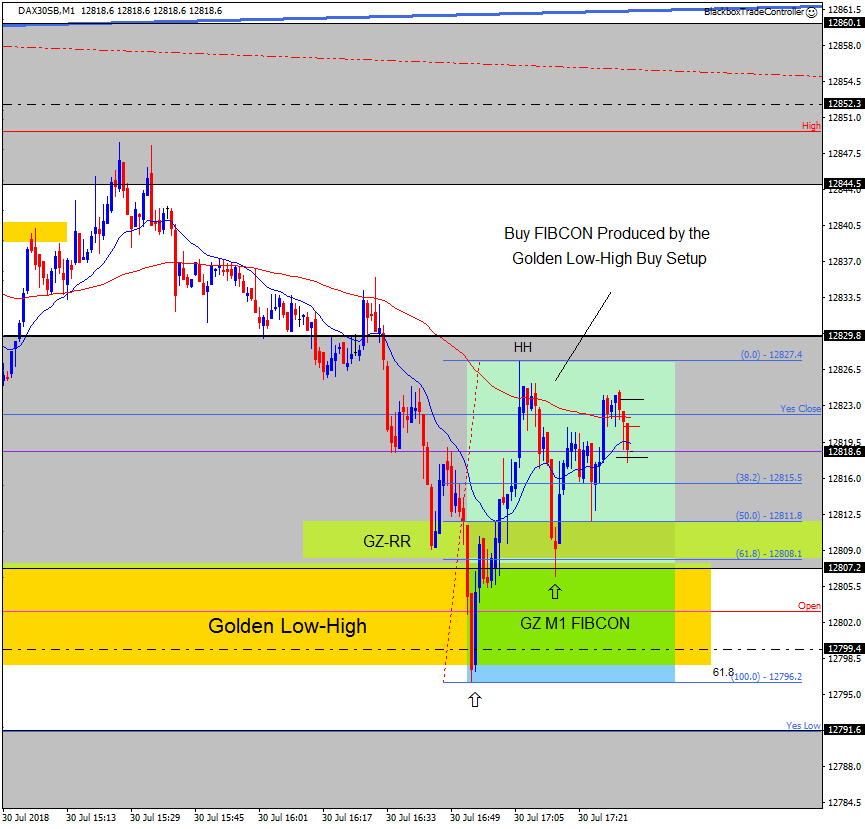
The 1 min chart below shows the same setup and how it went on to produce a GZ M1 FIBCON when price retraced to the 50% level of the Golden Low-High at 12807.2
When mastered multiple R is available from the initial Golden Low-High followed by the M1 FIBCON shown below!
12:43
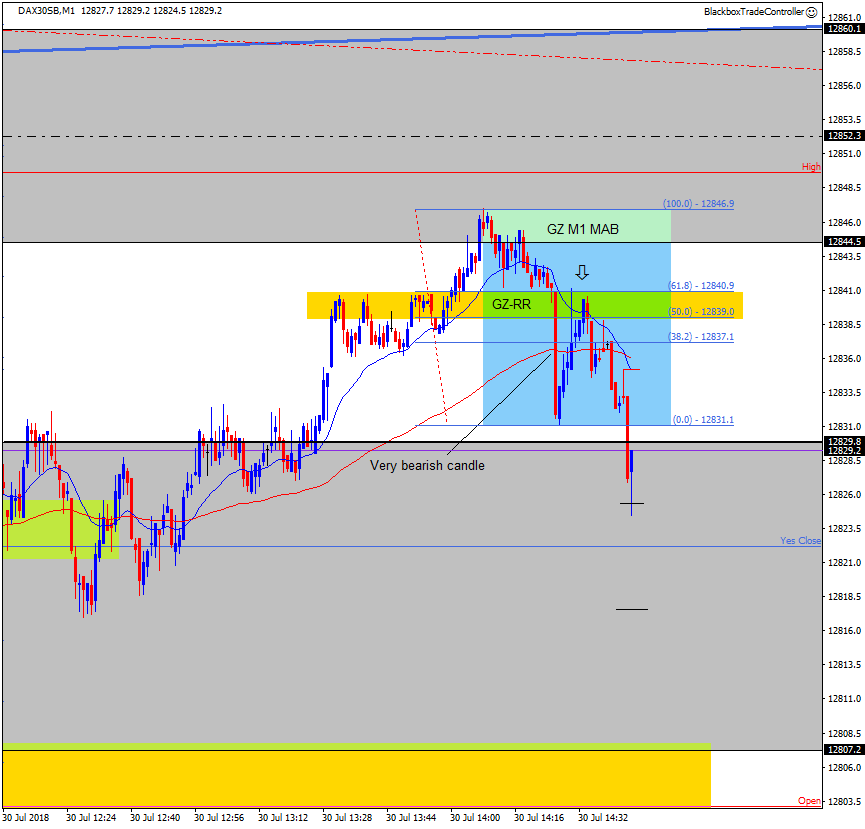
GZ M1 Sell MAB
Just come back to see what’s been going on to see this M1 MAB that’s just formed. Price has gradually crept up over the last few hours but the very bearish candle after price failed to hold above the 12844.5 level was a clue to price was struggling to go higher.
The setup had very good structure as shown with an excellent Golden Role-Reversal zone, look-left 🙂
09:38
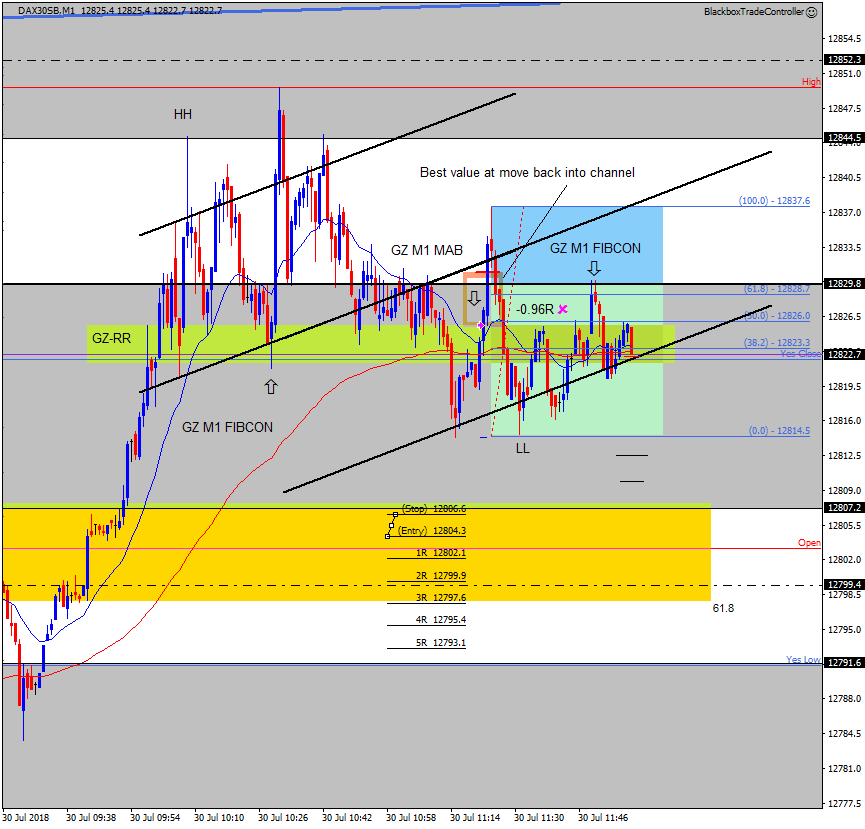
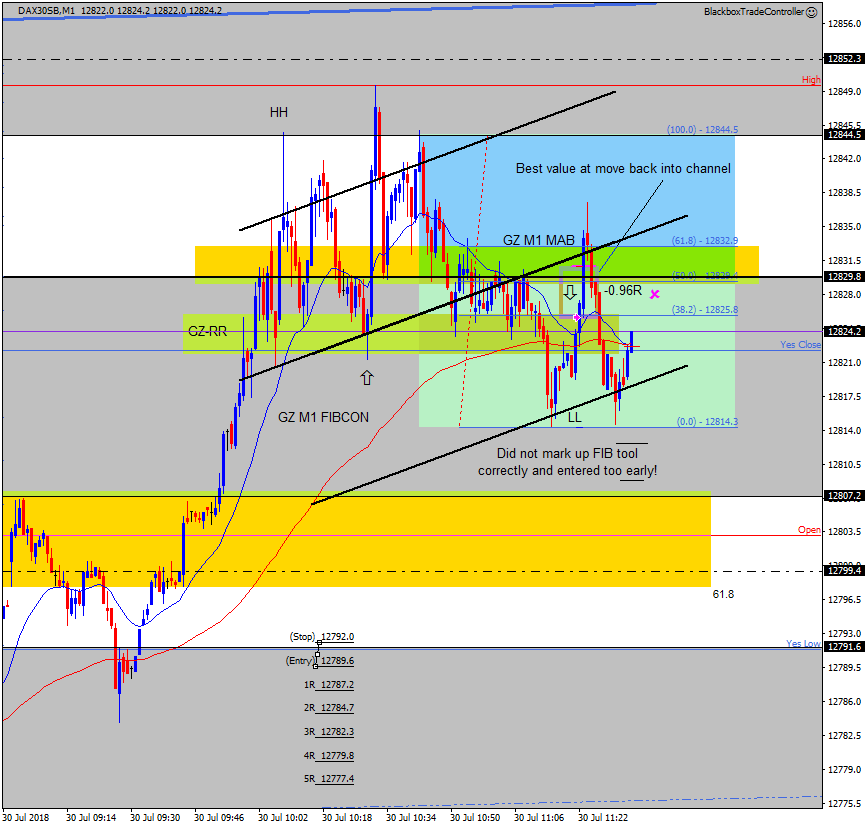
M1 Sell MAB Loser -0.96R
After the move down to form the LL I sold at the retrace to top of the earlier GZ at 12825.8 and M1 MAB.
This was too early as shown, I forgot to overlay a copy of the short term channel which was confluent with the LL. I may have passed and reasoned a better value entry would have been on the retrace up to the top of the channel – maybe??
I had also not marked up the best FIB tool which is shown, I’d taken point A from the 12829.8 level, too aggressive?
Very pleased I did not move my stop!
I don’t think I’d take this trade again, it was low value.
08:49
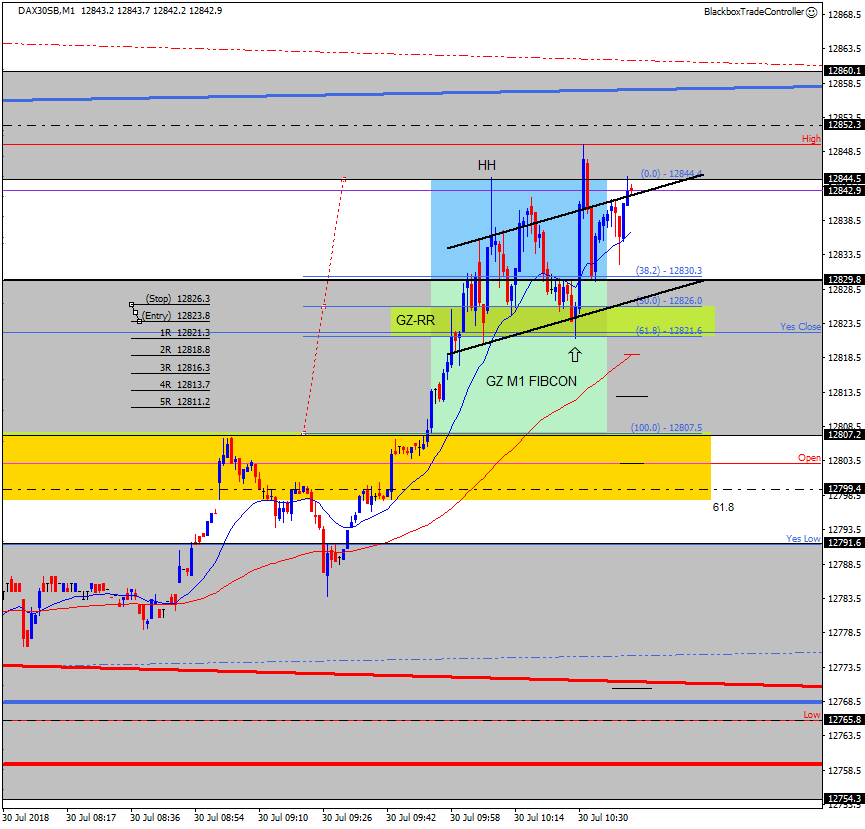
GZ M1 Buy FIBCON Setup
After a bullish move back up off the Daily Bull, Hourly Bear and Hourly mid-Bull Channels at 4am price moved up to make a new session High after the 8am open.
A good M1 FIBCON formed as shown when price retraced to Yes Close, the bottom of the GZ-RR zone at 12821.6, a good with trend setup that I just missed taking.
As mentioned last week, overlaying a short term channel after the move up can be very useful in determining trade entry, stop and target levels.
Friday 27th
08:59
Missed GZ M1 Buy MAB
I was not at my desk and came back to see a decent GZ M1 Buy MAB had formed after price had made a Higher-High at the H1 Bull Channel.
We have family visiting from crazy hot South Wales so I’ll not be trading anymore today. I intend to enjoy yesterdays results and not replace the memory just yet 🙂
07:20
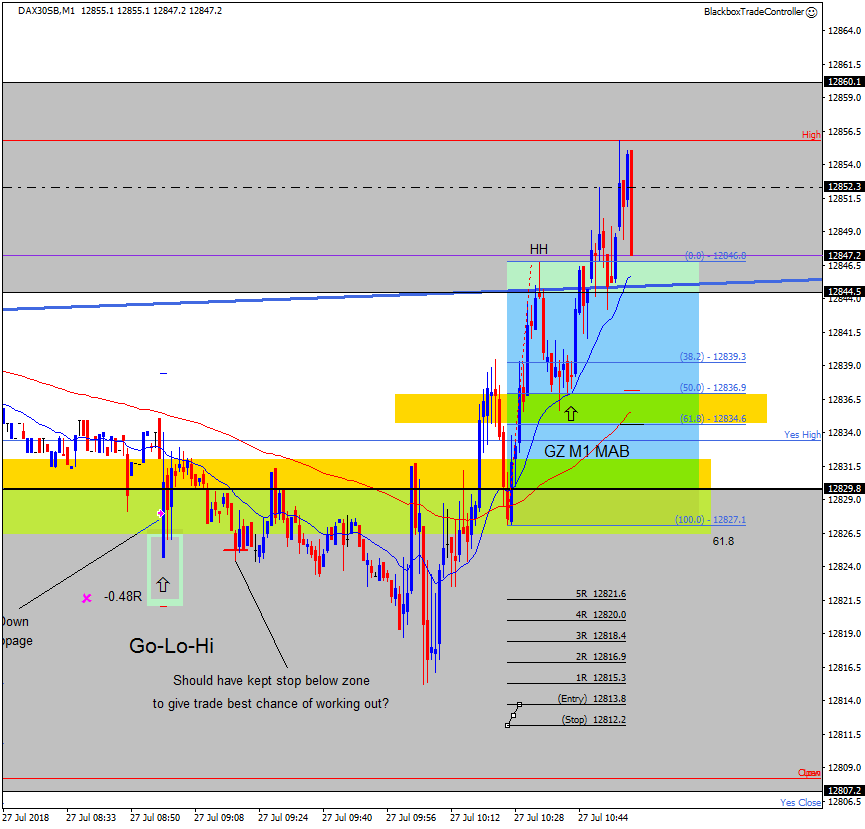
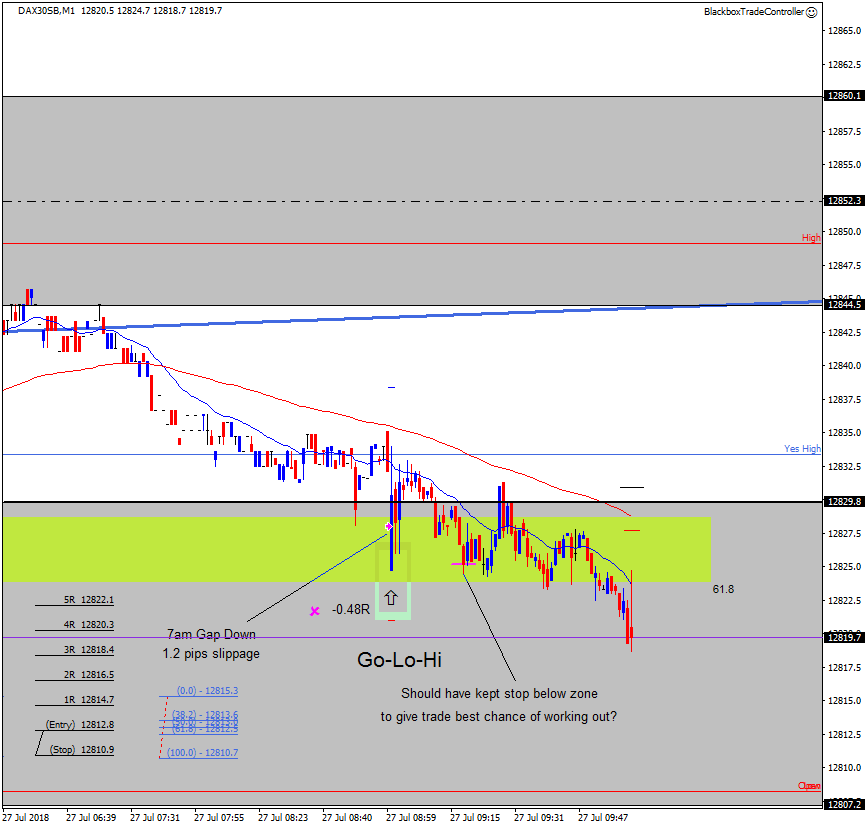
Golden Low-High Loser -0.48R
I anticipated price gapping down to test the 61.8 level of the current Go-Lo-Hi at 7am.
It moved so fast some slippage occurred, however it went into profit briefly before failing to get above Yes High. I reduced my risk and was eventually stopped out for -0.48R.
The idea was right but tricky to execute when price gaps at the 7am open. However, as I type the bottom of the zone is still holding and price is testing Yes High again.
I should have kept my stop below the 61.8 level to let the Golden Zone do its thing if it’s in play.
The trade was a buy and therefore had order-flow on its side due to the bullish price action of the last 36 hours or so.
Would I take the trade again?
Currently I’d say Yes and consider this as one that just didn’t work out!
Last Wednesday at 7am price gapped up to the 61.8 level of the Golden High-Low of the session then sold off strongly. Observing this is what finally made me decide it’s time to automate displaying this unique FIBCON.
Thursday 26th
22:04
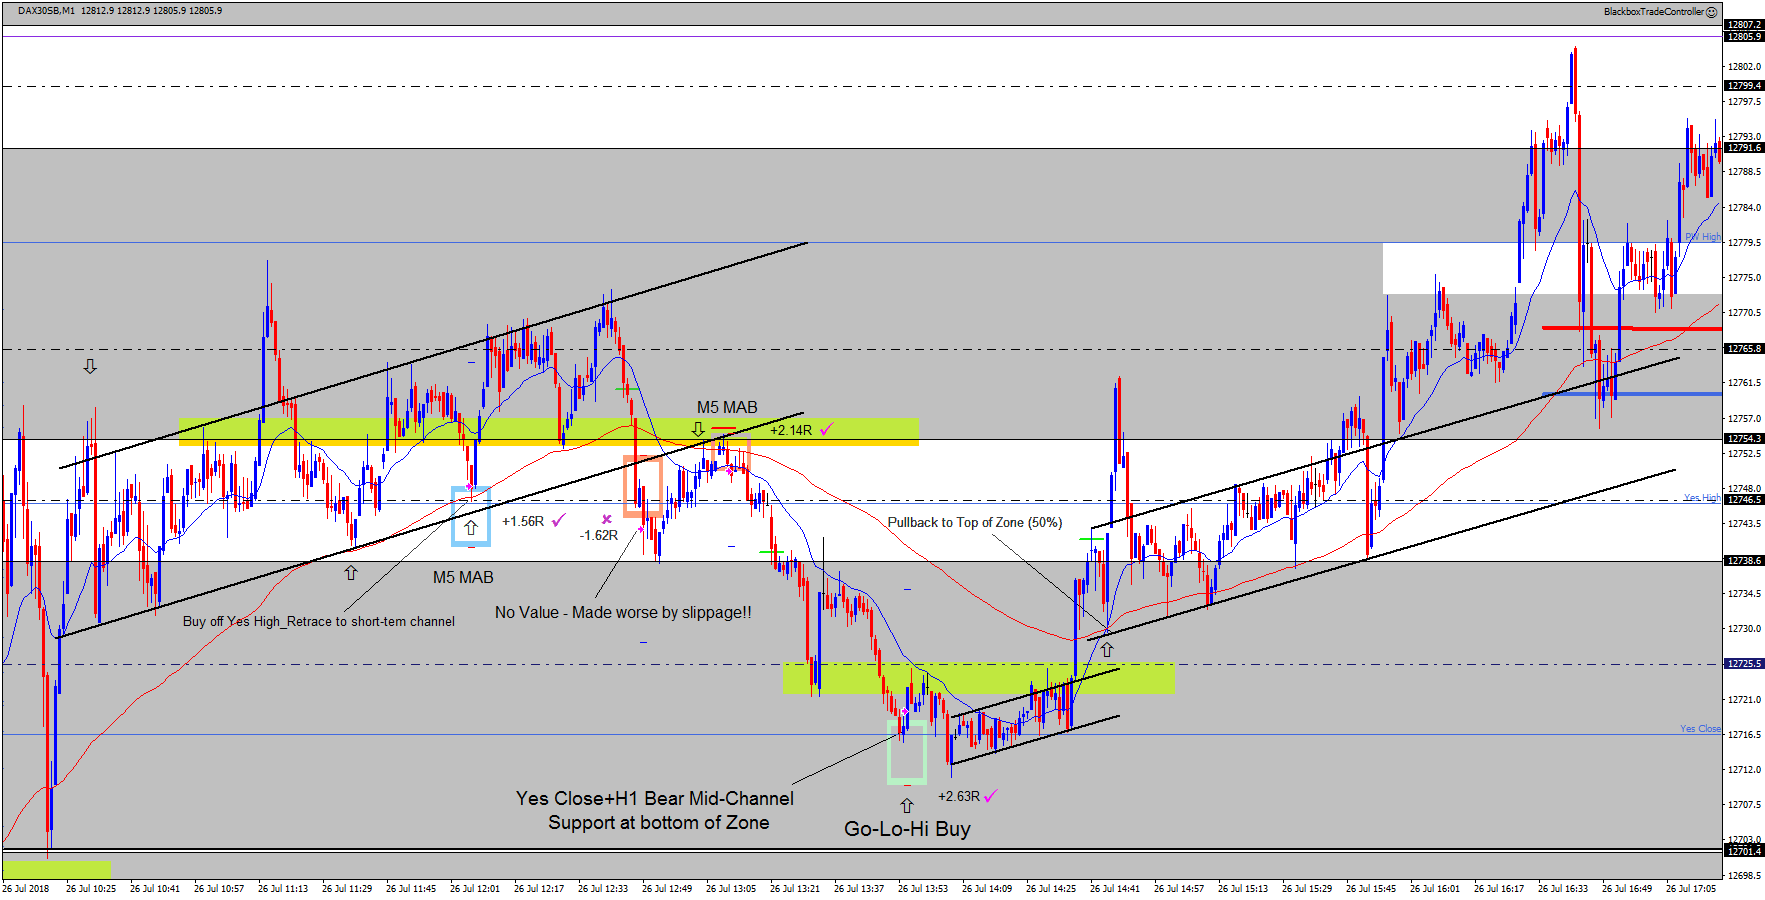
Cool Channels
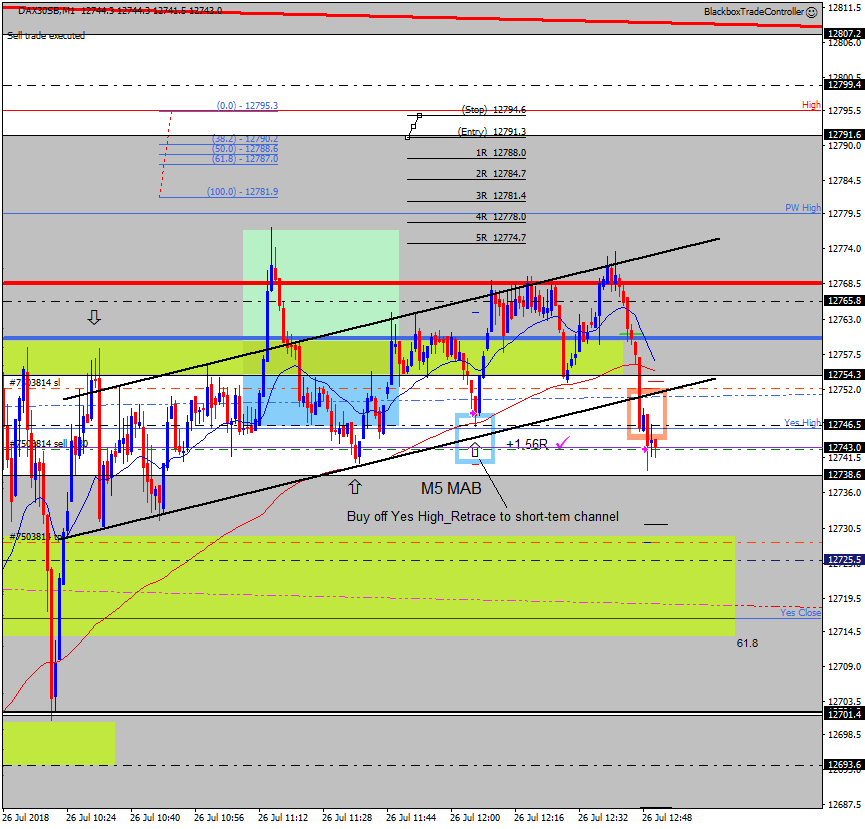
Whilst reviewing the session I thought it might be helpful to show how identifying very short term channels can be very helpful.
Note: I studied channels a lot whilst learning about trading, it’s time to rediscover how useful they are. Developing the habit of marking them up as soon as possible is extremely important. I only had the first of these marked up in real-time, going forward I intend to look for them and profit from them!
If you can spot the channel early on it adds another level of precision to trade entry and target levels. These 1 minute channels last a short period of time before they break down but provide great guidance on short term opportunities.
It takes practice to mark them up by following a simple method each time then adjusting them as price guides you.
14:16
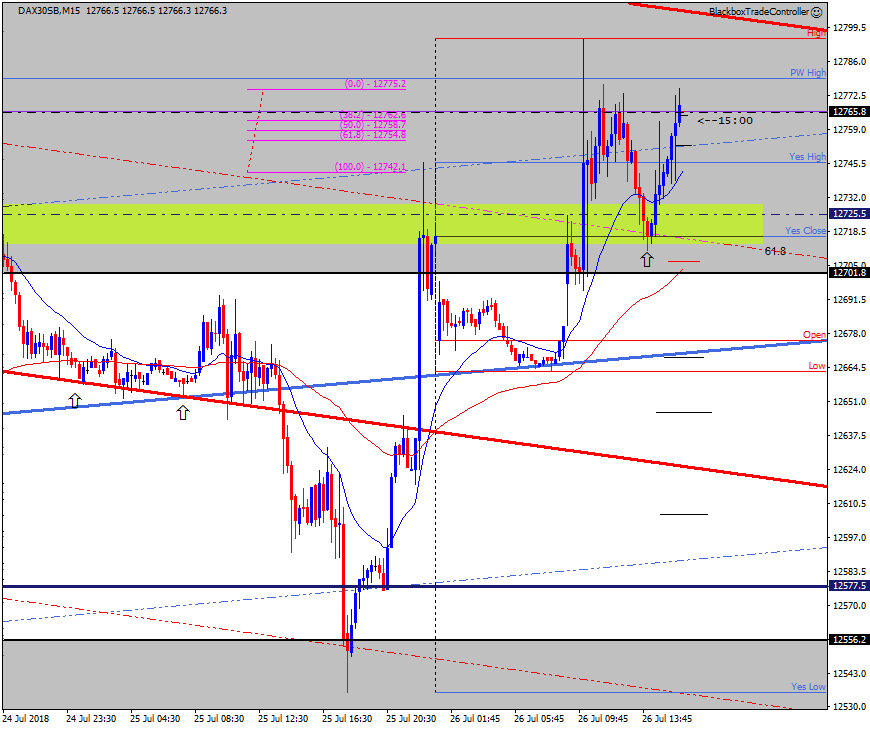
How the Golden Low-High played out
This 15 min chart shows what happened after my earlier Golden Low-High winner.
It’s not easy riding up such relatively large swings but price has eventually moved on up and is currently sat at the 12765.8 level, just below the PW High.
The arrow shows where I entered the trade, really pleased to have finally traded one after seeing so many of them over the last 2 weeks after the event.
It shows the power of the zone when price
12:55
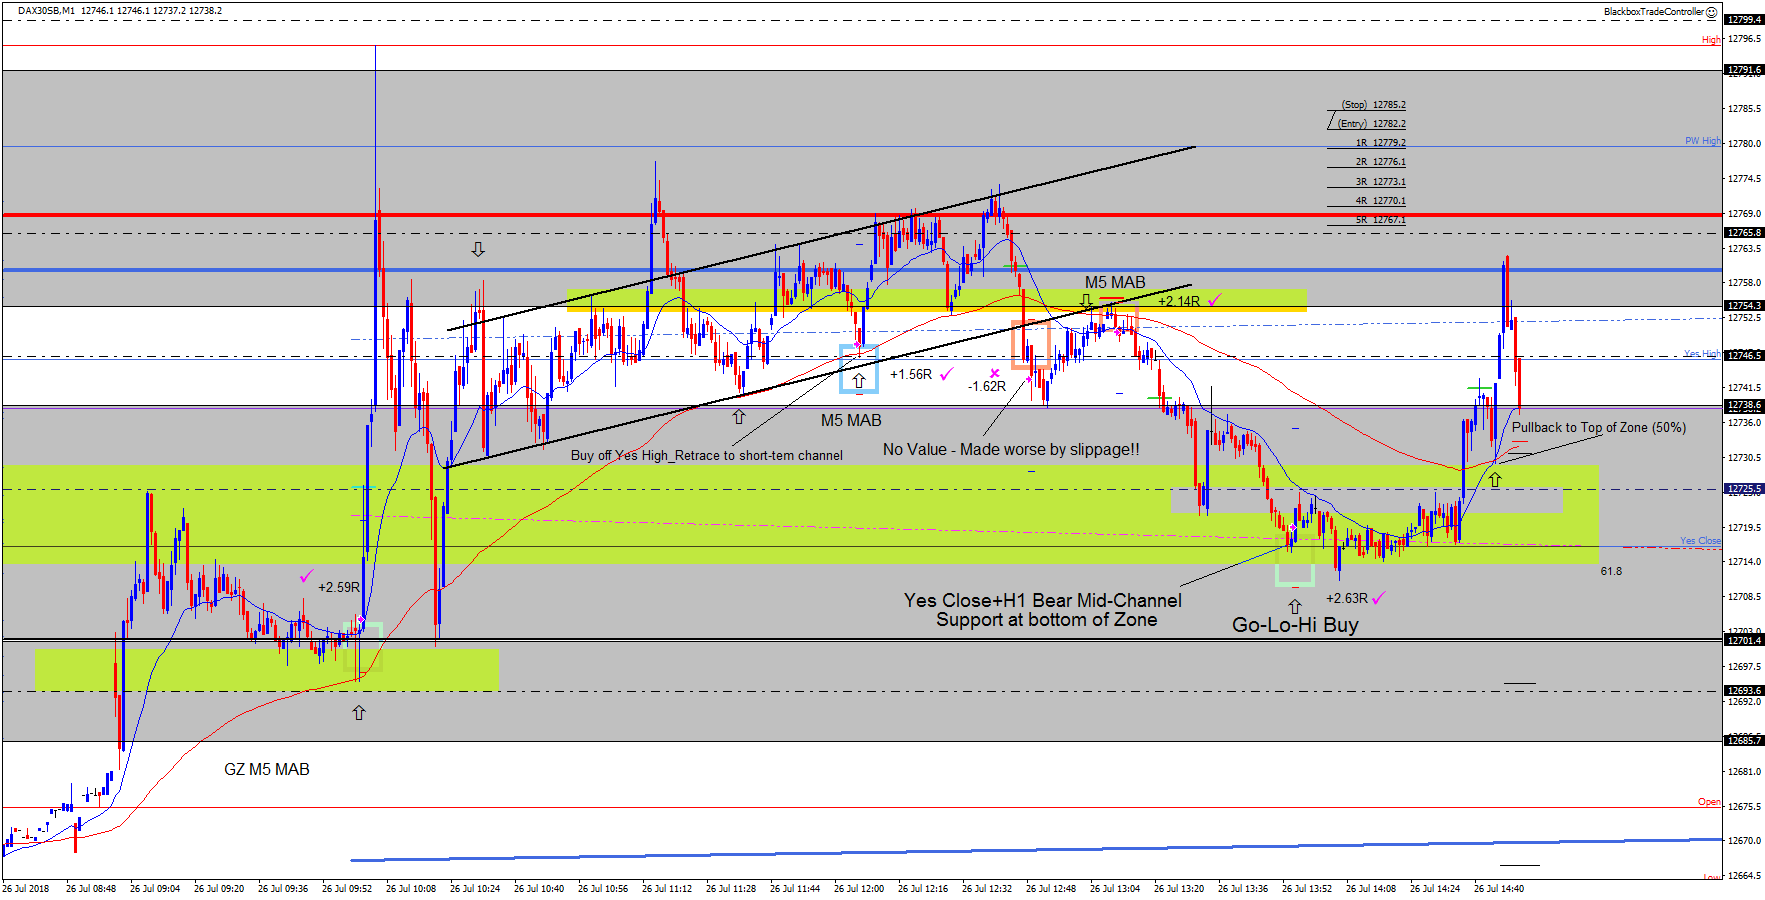
Golden Low-High Buy Winner +2.63R
I’m stopping for the day as I’m currentlyup +7.30R, my second best day since going live 🙂 🙂
The earlier -1.62R was an awful trade and a reminder of how bad habits need to be flushed out of the system, however….
I’ve just had my first Golden Low-High Buy winner off the bottom of the zone. The first one I took earlier in the week was a loser and poor quality, this one felt different due to the confluent structure at the bottom of the zone in the form of:
- Yes Close
- Hourly Bear Mid-Channel
- M5 Bear Channel – see below
Such confluence was missing the other day. Price briefly moved down to my stop – which I did not move – but then moved back up, such fine margins!!
Also, when you look-left the zone had decent role-reversal support from earlier in the session when price moved up (12725.5) just after the 7am open.
The 5 min chart was supportive (see below).
Price took a while to finally break back above the daily EQZ mid-line at 12725.5 but when it did the pressure that had built up meant I was rewarded with a +2.63R winner 🙂
Note that price then pulled back to the top (50% level) of the zone before making a second leg up to Daily Bull Channel where it failed to hold the level.
Below is the 5 min chart ,it shows where I entered the trade. Note the bear channel that helped to support price at the bottom of the zone – the 61.8 level.
This is why I wanted to update the bssIntradayKeyLevels indicator to automatically display and update the session’s Golden FIBCON. Throughout the week it can highlight great trade entries, not all the time of course but let’s study it closely. It’s worth mastering!
11:13
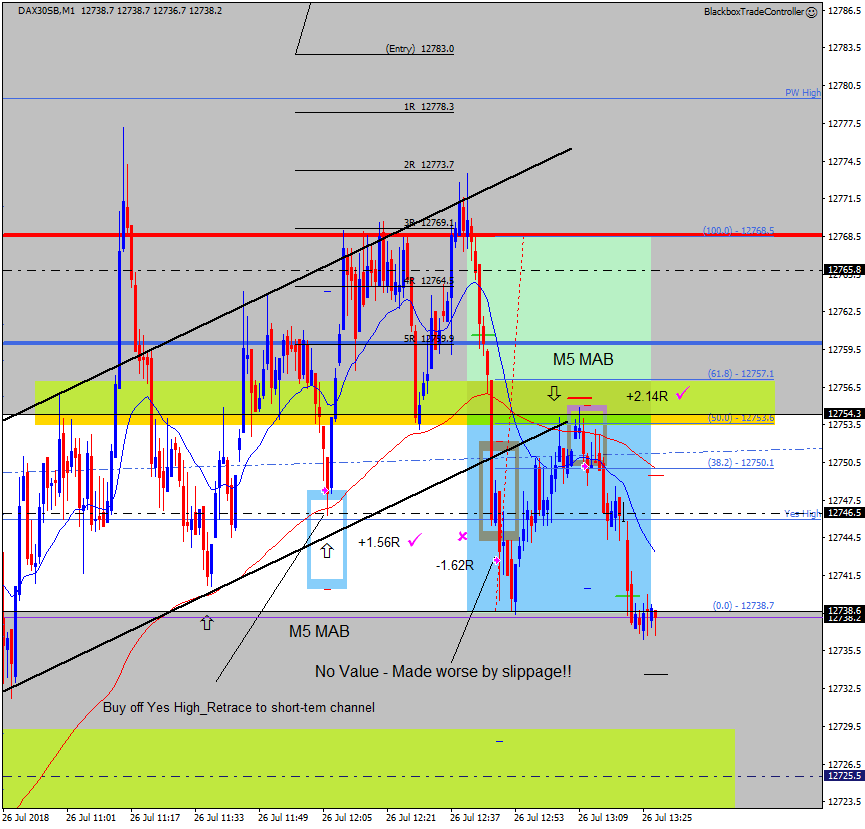
GZ Buy M5 MAB Winner +1.56R, Poor Sell -1.62R loser
Took a great M5 MAB buy and pushed for more R, it reached just over 3R before retracing to my stop resulting in +1.56R
I did not have the upper boundary of my short-term channel correct, it was too high, on the screenshot it’s corrected, I might have closed out for a much better result – maybe?
When price failed I ended up taking a very poor value sell by chasing price!!! The slippage made it worse!!
This resulted in a -1.62R loser as I moved my stop, a spiral of bad habits!!!!
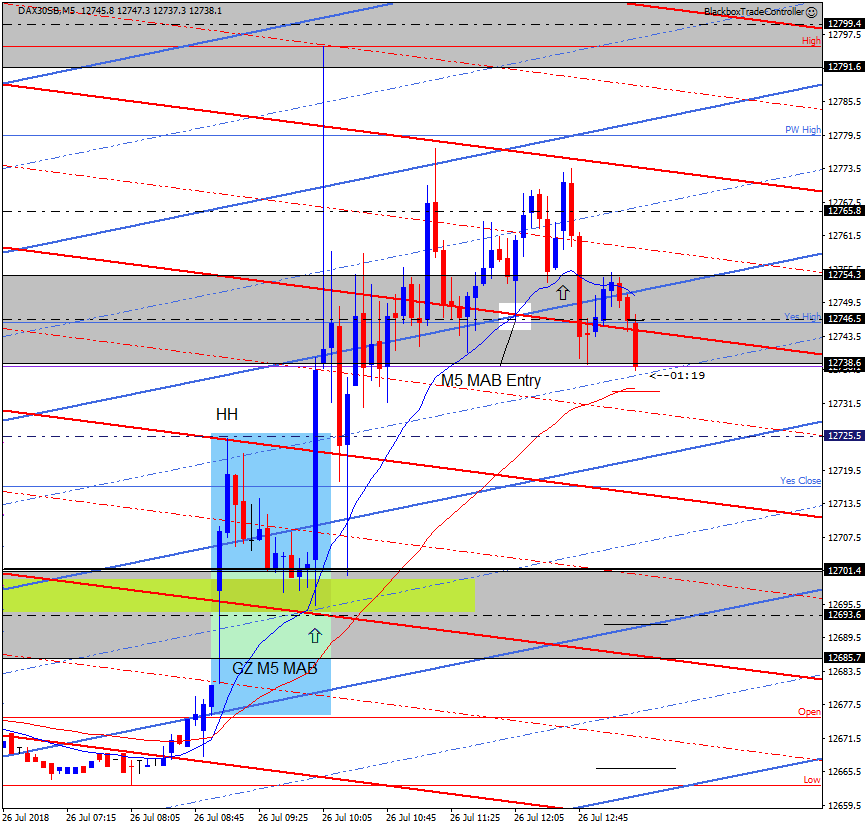
Below is the 5 min chart and like the earlier trade shows how supportive it was of the buy setup. It was confluent with:
- M5 MA
- Yes High
- The M5 EQZ mdi-line at 12746.5
- M5 Bear Channel
- M5 Bull Channel
Great setup, should have closed out for at least 2R.
08:36
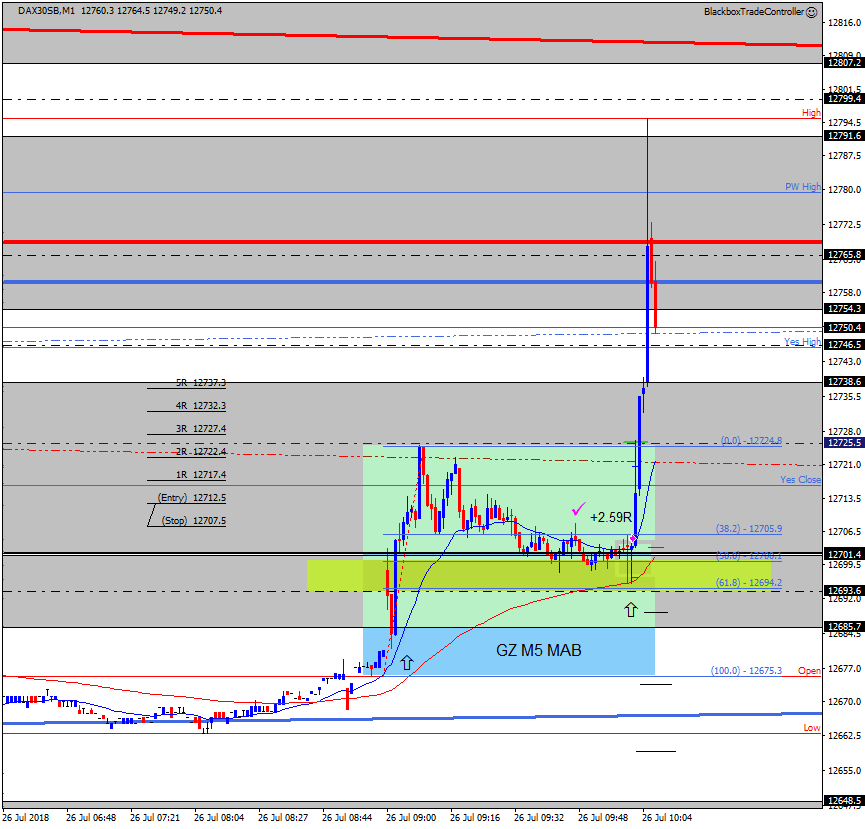
GZ Buy M5 MAB Winner +2.59R
At 7am a gap up to the Hourly EQZ level of 12701.4 took place followed by a quick spike down to close the gap perfectly before moving back up strongly.
A very bullish follow on from yesterdays late bull move up.
At the London open I had the M5 MAB marked up and after 2 pin-bars I entered the buy trade that came in after 28 seconds plus on this occasion the gap went in my favor for a +2.59R winner 🙂
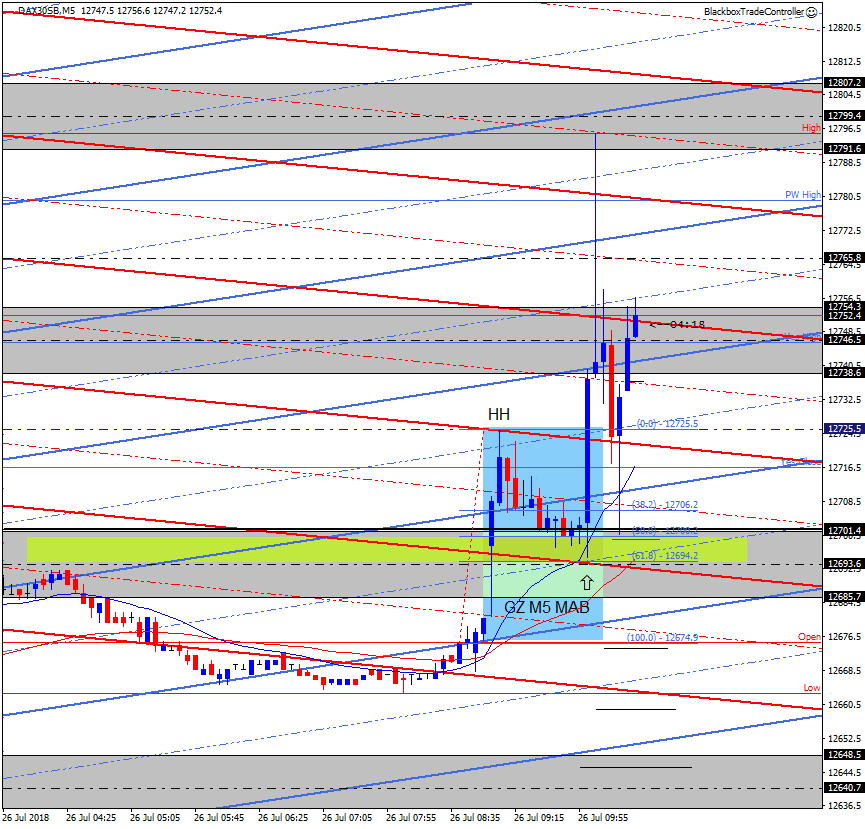
Price stormed on up to push through the PW High before a sharp retrace to form an extreme pin-bar as shown below on the 5 min chart.
Shame I didn’t move my target in time as the clues were there that bulllish energy wanted to release itself into the market!
Below is the 5 min chart that was very supportive of the buy setup. The arrow shows trade entry, note the confluence of:
- The 5 min EQZ mid-line at 12693.6
- M5 MA
- M5 bear channel
- M5 bull mid-channel
- 61.8 with point A taken from the Open
A great trade to start the day 🙂
Wednesday 25th
09:19
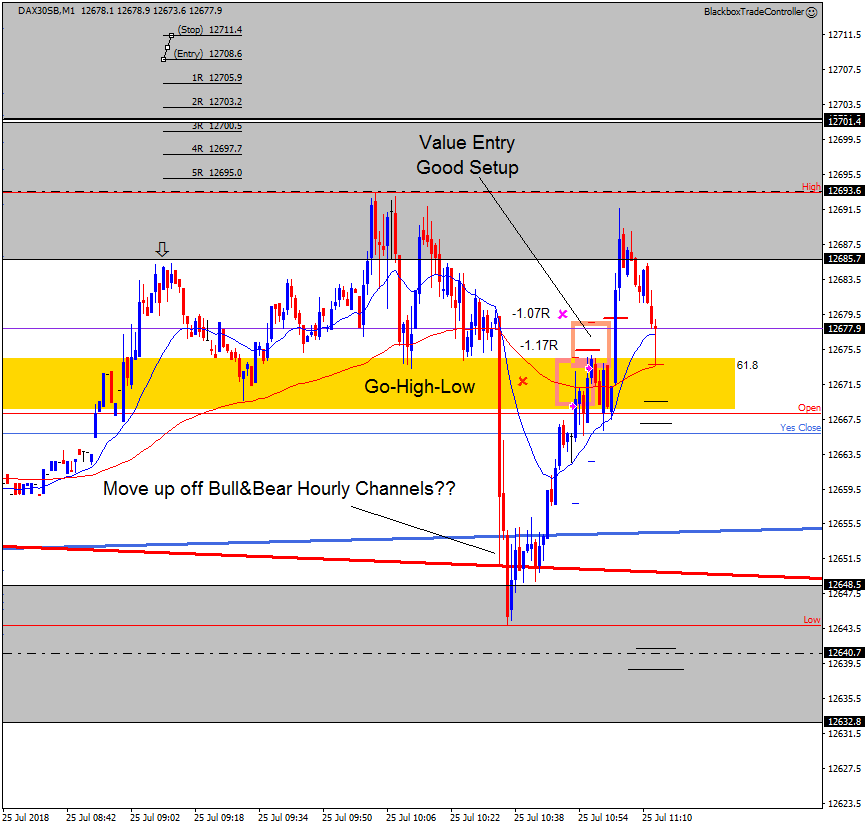
GZ Sell MAB Losers x2, -1.07R,-1.17R
Really liked the sell setup at the 61.8 level of the current Golden High-Low. Ended up taking two trades 🙁
A major battle took place in the zone but on this occasion price went up to test the High then sold off again.
One clue was that price was moving up off the Low where both bull and bear hourly channels provided support.
However, the sell setup at the 61.8 level was supported by the 5 and 15 min charts so would I take the trade again?
Certainly the second trade was the best value of the two and I class it as one that just didn’t work out and I’d take it again because we deal in probabilties and we can’t win them all! The key thing is to be consistent each time a decent setup forms.
Tuesday 24th
18:55
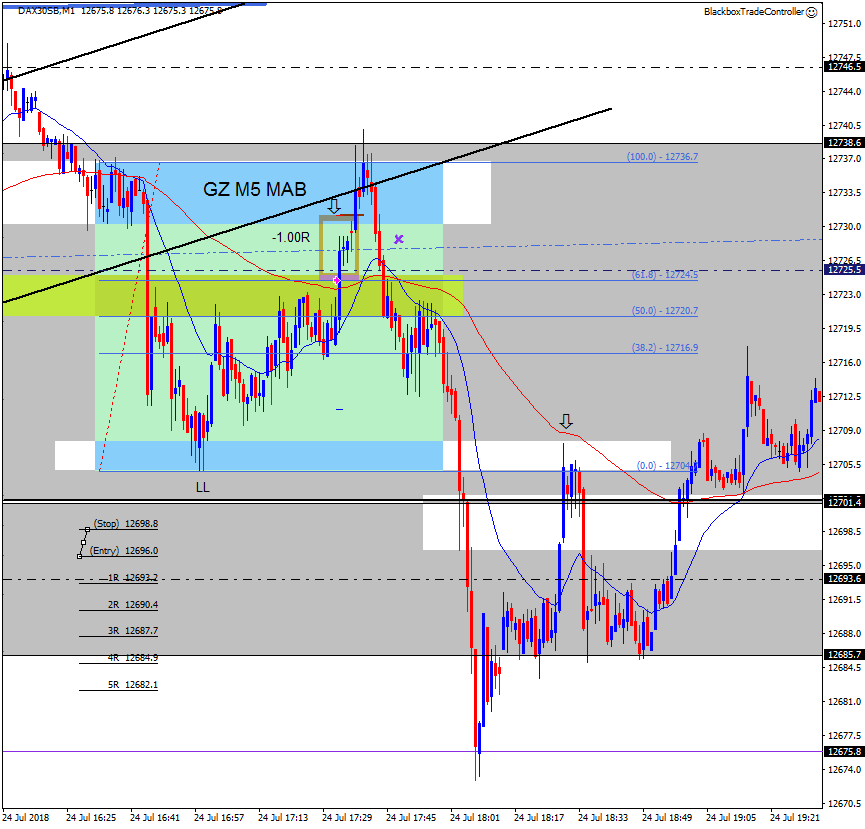
GZ M5 Sell MAB Loser -1.00R
The setup was a sell M5 MAB that really liked except that it was a sell in what was still a bullish session after the morning bull spike.
Very happy with the execution as I waited for it to reach the 61.8 level, it just didn’t work out. Had I taken point A from the High then I might have passed and watched what happened when price reached the 12738.6 level.
From there it sold off strongly back down through the key hourly level of 12701.4 offering a good sell on the retrace back to it as shown by the arrow.
12:01
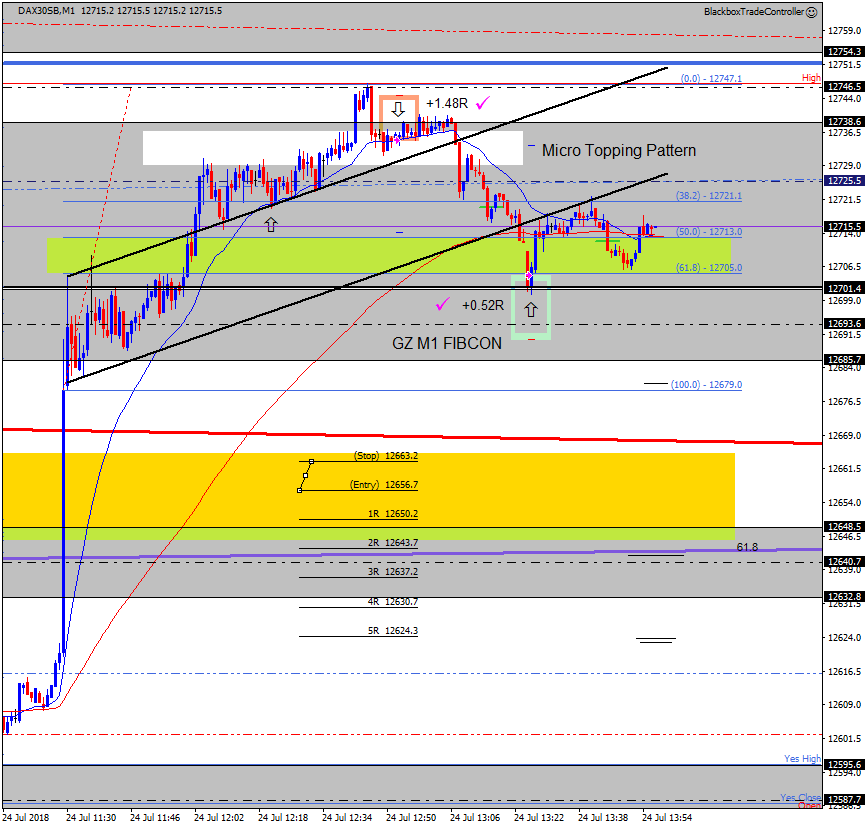
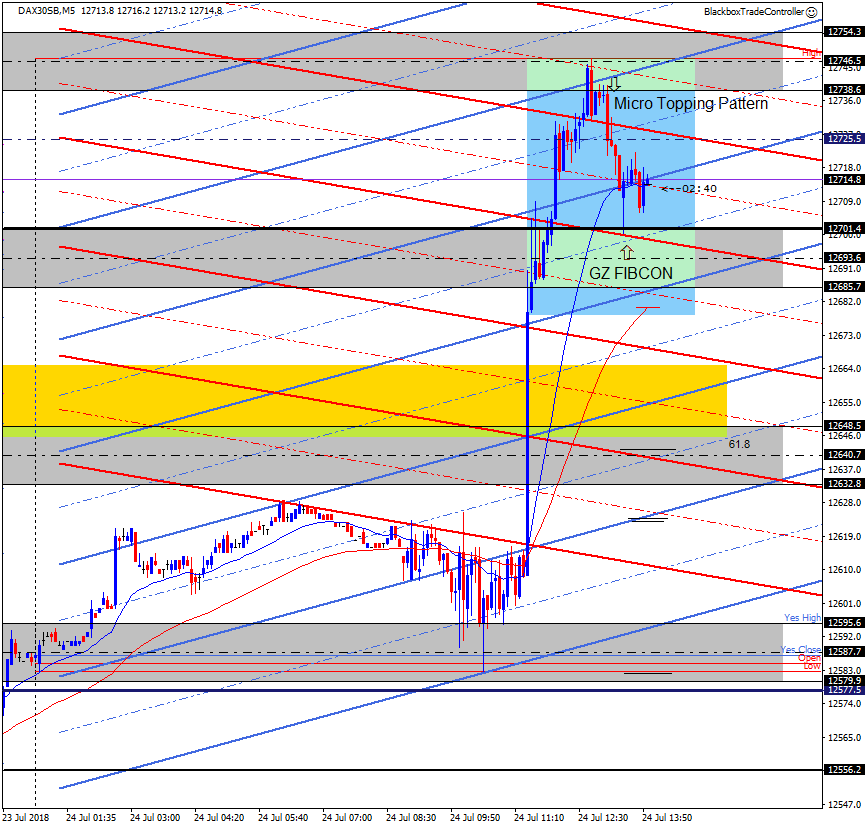
Sell Winner +1.48R, GZ M1 Buy FIBCON +0.52R
There was no clear buy signal to ride up the bull spike at 09:30 so I had to Be The Bear and wait!
When price reached the M5 Eq-zone mid-line at 12746.5 just below the Daily bull channel the price action shows signs of a short-term top.
I liked the micro-topping patten after the break below 12738.6 so entered a sell trade. This was quite aggessive after such a strong bull move but had seen enough of these to reason that probability was on the sell side, at least very short-term.
Eventually price moved down but I closed out early for +1.48R due to the M5 MAB at my target. Of course it then went on down afterwards to the key level at 12701.4
I’d already decided to buy at the 12701.4 level but ended up with a larger stop than I wanted. This buy was supported on the 5min (see below), 15min and hourly charts.
When price stalled I closed out for a 0.52R winner. As I type price is in a short-term range at the level I closed out.
Below is the 5 min chart with the arrows showing my trades entries and how the Price Action Grid structure supported them.
So overall I’m pleased with being +2.00R up from the morning session. I was helped by displaying our updated ‘Be The Bear’ page 🙂
09:14
Tight range so far.
A very tight range so far after yesterdays break back up above the daily Eq-Zone at 12577.5
Price is ranging around the current Golden Low-High, this zone is one to watch going forward. The idea is we learn when it is most effective in our trading decisions.
There will be days when it plays no part in them but there will be days when it offers great multiple R opportunities 🙂
We must continue to develop ‘Being The Bear’!
13:34
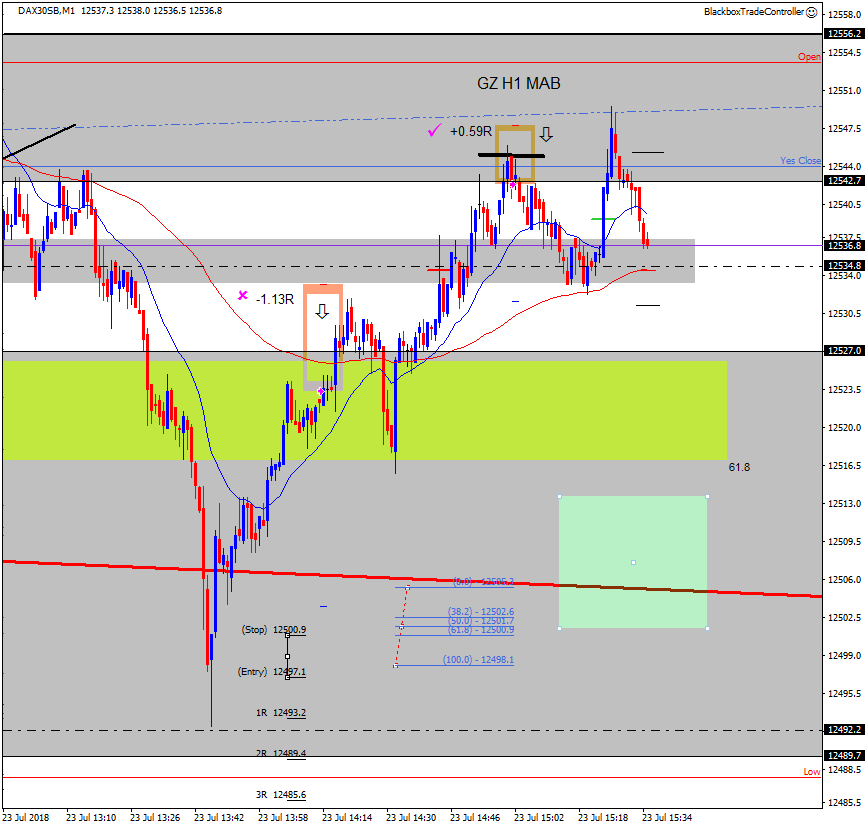
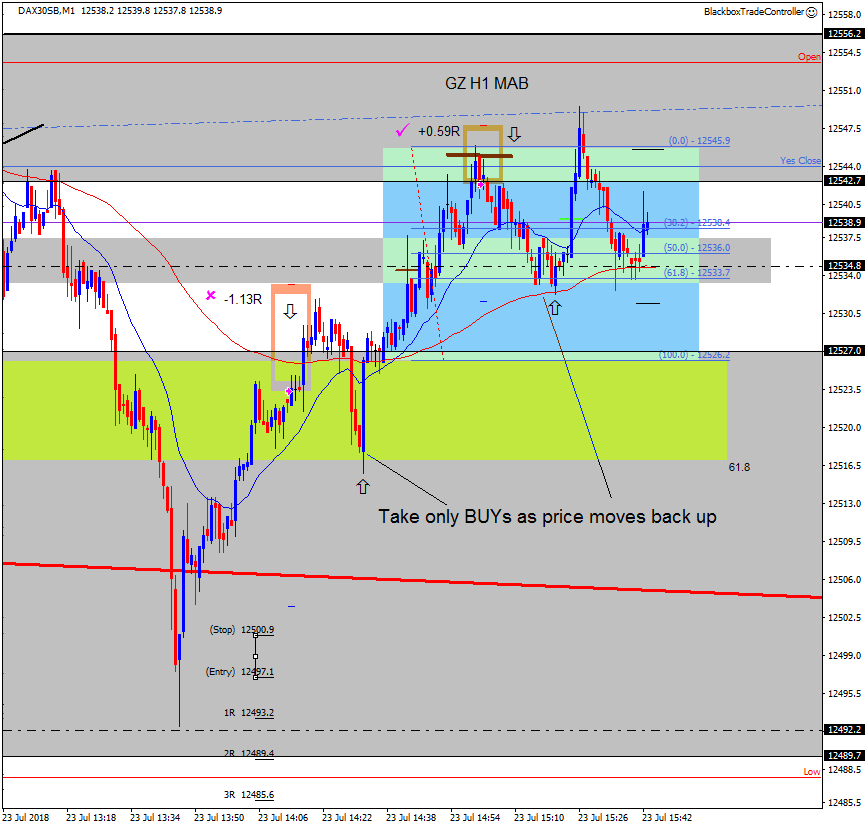
GZ H1 Sell MAB Winner +0.59R
Took the H1 MAB sell at Yes Close and the 12542.7 level.
Closed out for a small winner which was a good call as price then went on to hit my stop.
Some BIG lessons today 🙂
On a range day like today when price has gone from the High down to the Low and is moving back up into the range ONLY take buy trades on pullbacks.
Do not take sells even though the setups are good structurally. It’s a probability game and some of the sells will work but today they were only brief pullbacks before the next leg up.
12:41
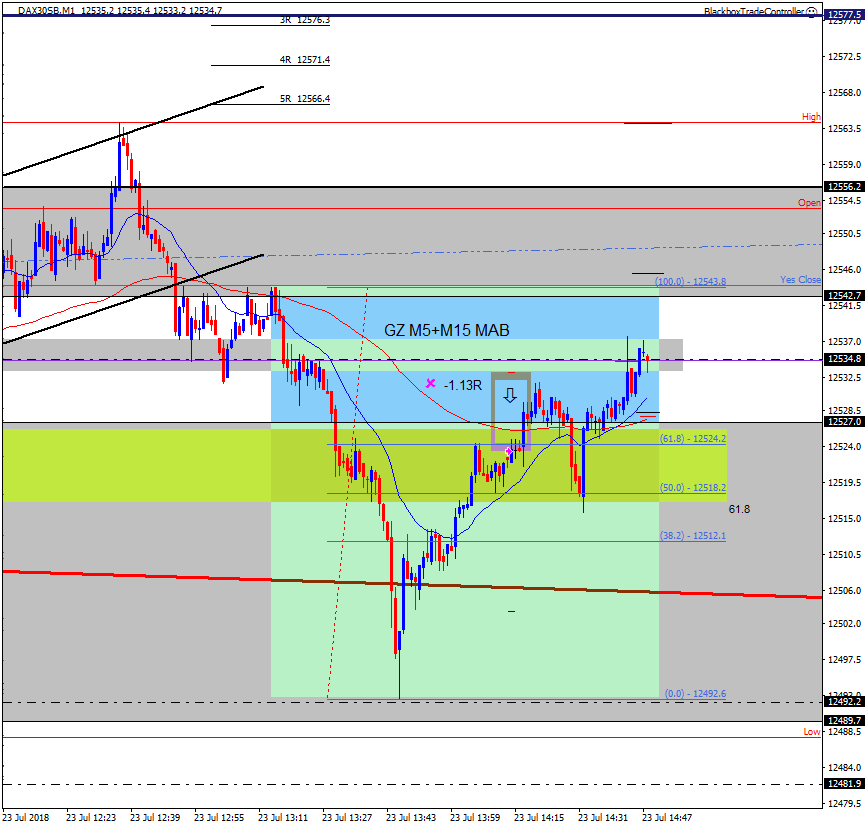
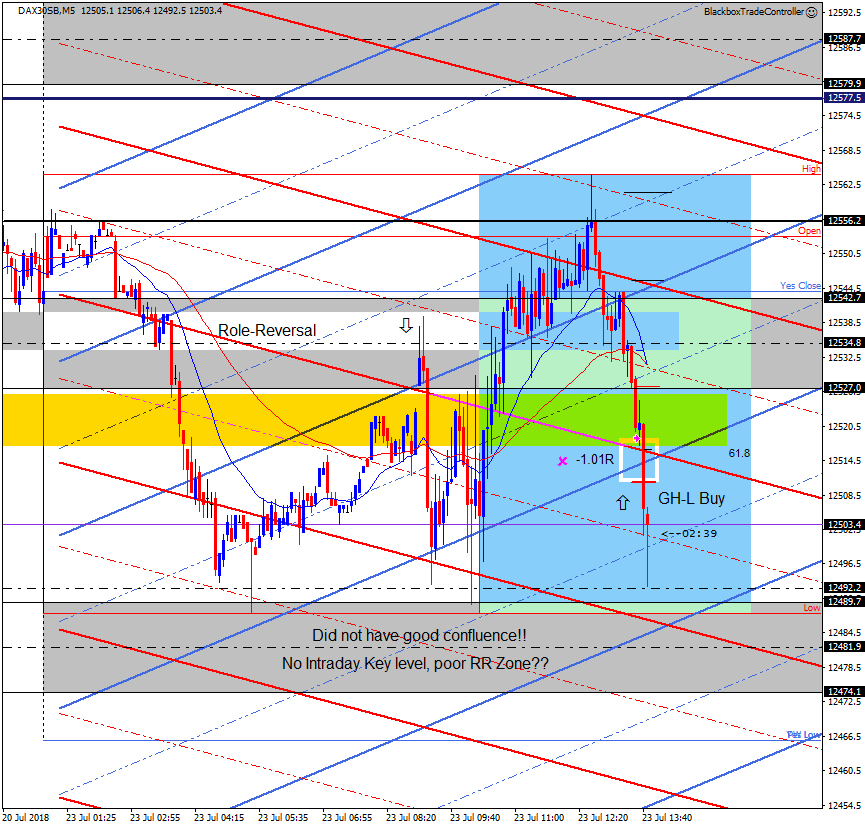
Golden Low-High Loser
Waited patiently for this buy but I must admit to not having that feeling we speak about 🙁
There were no intraday key levels in play plus the RR zone when looking-left was not convincing. I entered with my stop below the 5 min channels but it wanted to do down to test the 12492.2 level.
I’ll admit to entering the trade probably because of the focus on the session’s Golden Zone and FOMO kicked in.
I would not take it again, a poor trade and the zone did not have good confluence.
07:20
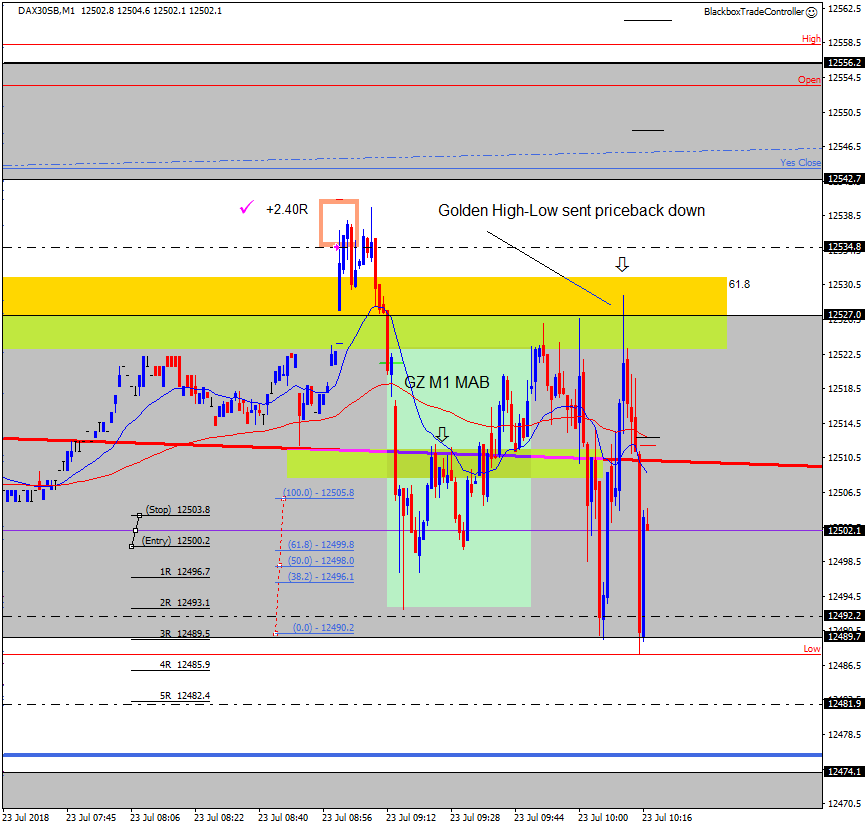
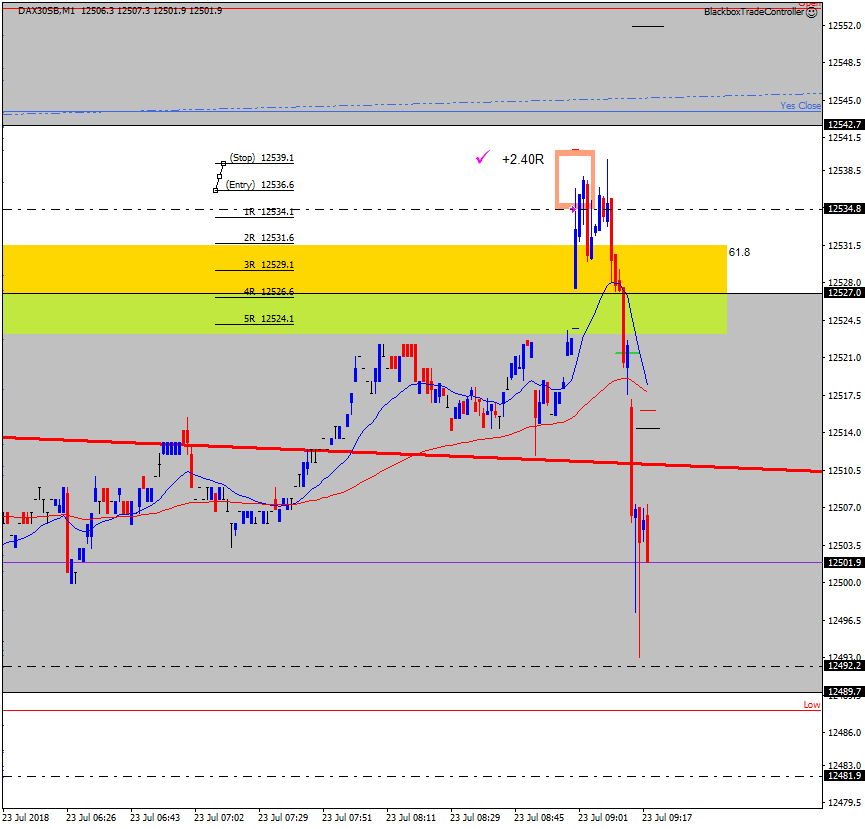
7am M5 Sell Winner
Took an early sell on the 1 min chart but based on a Role-Reversal zone just above the 61.8 level of the session’s Golden High-Low best seen on the 5 min chart – below.
I didn’t max out the profit potential but happy with +2.40R.
The screenshot below from the 5 min shows clearly the RR zone, was almost stopped out but a 100% WTA.

I would have normally taken both trades so I share your thinking.
What I don’t know is if on the second trade, after it tested the YesClose, I would have moved my stop loss to lock in profit to at least breakeven. Tough call, attractive set up though!
Good point. The trade reached about +0.85R and I did think about reducing my risk and with hindsight should have!
The sell at the high was a cracker but passed after two losers. Another range day so far with it settling into the lower half of the session as shown by the Golden High-Low zone and the hourly bull channel defining the lower boundary.
https://blackboxsoftwaresolutions.com/wp-content/uploads/2018/07/dax30sb_M1_25jul2018_1255_xxxxxxxx_xxx_range-setup.gif
I liked how you managed risk on the first trade. I was looking at the charts and would have entered it and adjusted stop loss to a similar level.
The second trade looks like mine, not yours! The 61.8 level of the marked area was worth waiting and trading it, even with the M1 MAB a little bit far from it. I was thinking about how to deal with the stop loss on that hypothetical trade, as there was a possible high-low FIBCON in play. Probably to follow the M1 MAB would have been the wisest decision unless you decide not to touch it!
Tricky third trade, important what you mentioned about the SUPCON area. I was feeling confident after anticipating the previous FIBCON so I would have traded it too.
You missed the best trade (the GZ M1 FIBCON), otherwise, if maxed out that setup you would be 2R up for the day!
Yes, the second trade was bizzare, that’s why I closed out once I’d observed the bad habit in me 🙂
The following retrace was the best one of the session so far as you note.
I’ve just updated the blog with an in-depth analysis of why I shouldn’t have taken the sell into the area of SUPCON.