Fri 29th June 2018
07:44
I’ll not be trading today as it’s a great day to enjoy my birthday and go for a 50 mile round trip ride up the coast and back 🙂
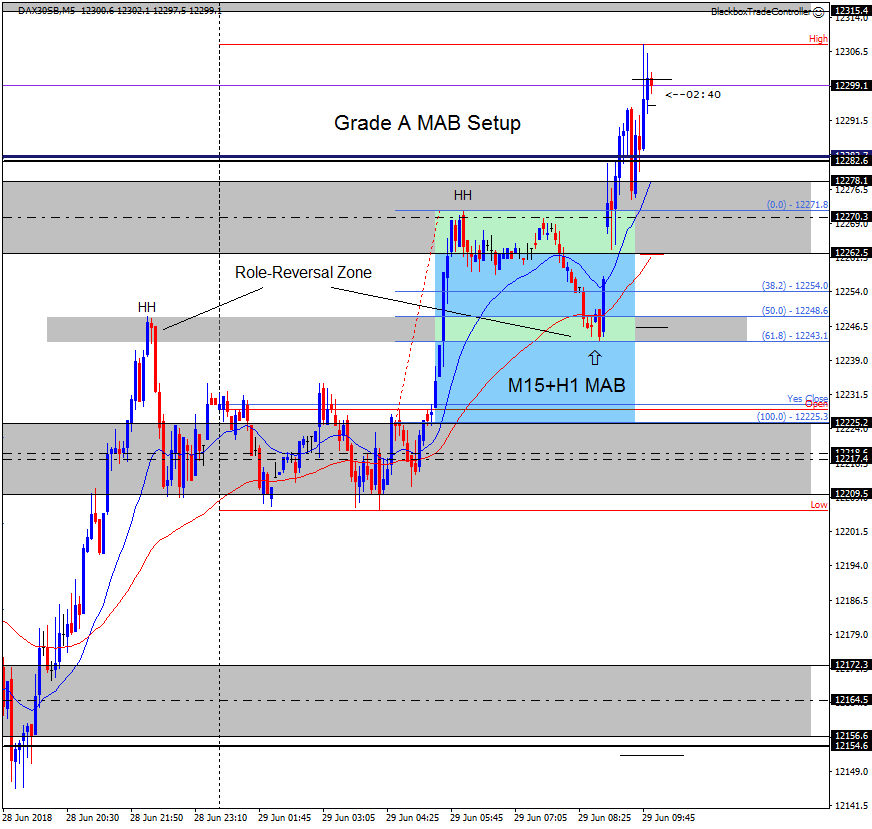
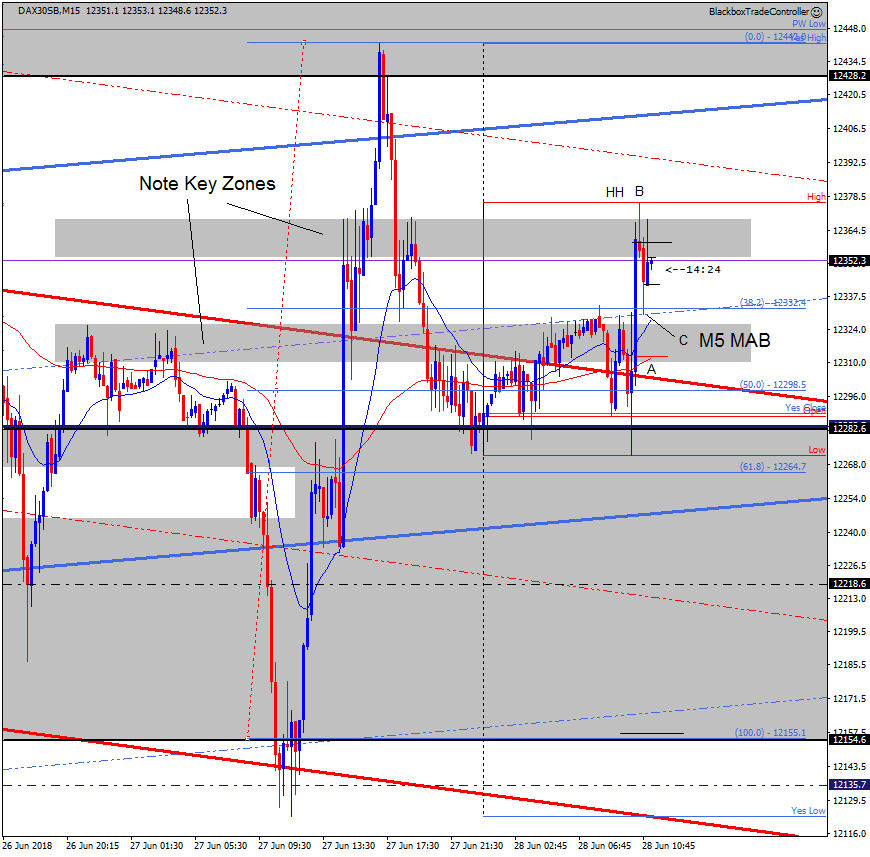
However, I sat down just afer 7am to see an M15+H1 MAB that had just reached it’s point C at around 06:50. It had great structure as shown on the 5 min chart below, the 15 min chart also shows this clearly.
The reason this was a Grade A setup can be seen by Looking-Left. Yesterday evening produced a short-term HH, overnight the market went into a range before the impulsive move up.
Price retraced precisely into the Golden/Role-Reversal Zone which was precisely confluent with the HH from yesterday evening.
Once again note how good the structure is, all the setups posted to this blog conform to our trading edge. When setups like this come along it’s hard to talk yourself out of them 🙂
Blackbox will see you on Monday, enjoy the great British weather 🙂
Thu 28th June 2018
11:33
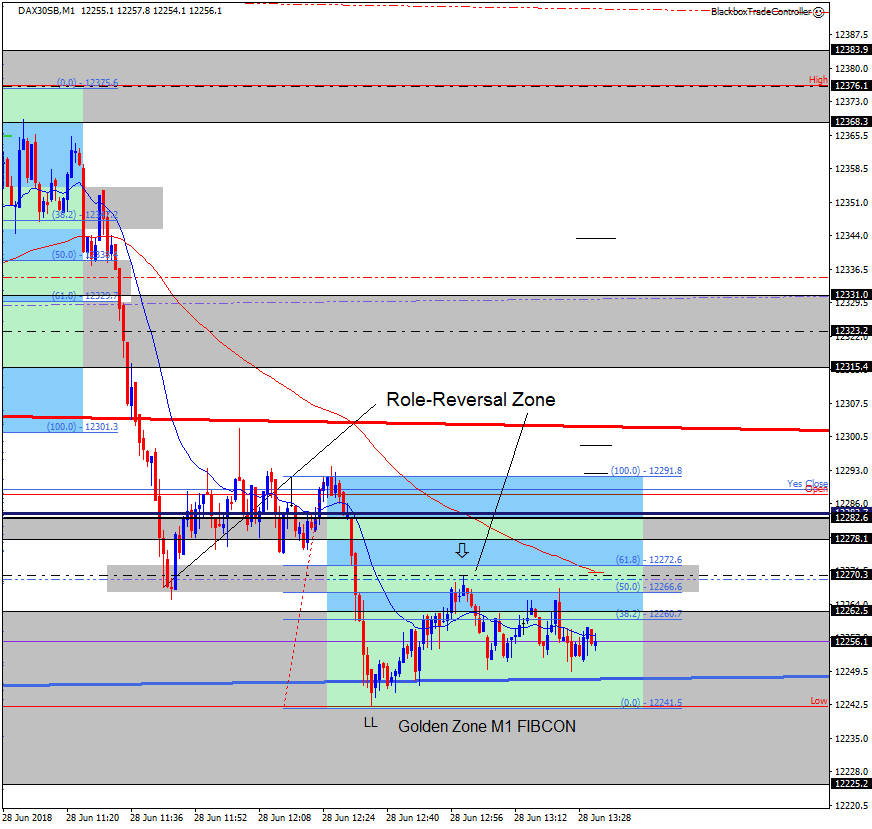
I was away from my desk for a while and have just returned to see that the bears are still in control and a decent Micro-FIBCON has recently formed.
Once again the Price Action Grid is capturing all the key turning points to produce high quality setups 🙂
Repetition repetition repetition !!!
The mind loves it when learning a skill, all the setups we put in the blog conform to the Blackbox Trading Edge, this latest one below shows how vital it is that the Golden Zone defined by points A and B line up with previous (Look-Left) Role-Reversal zones.
09:27
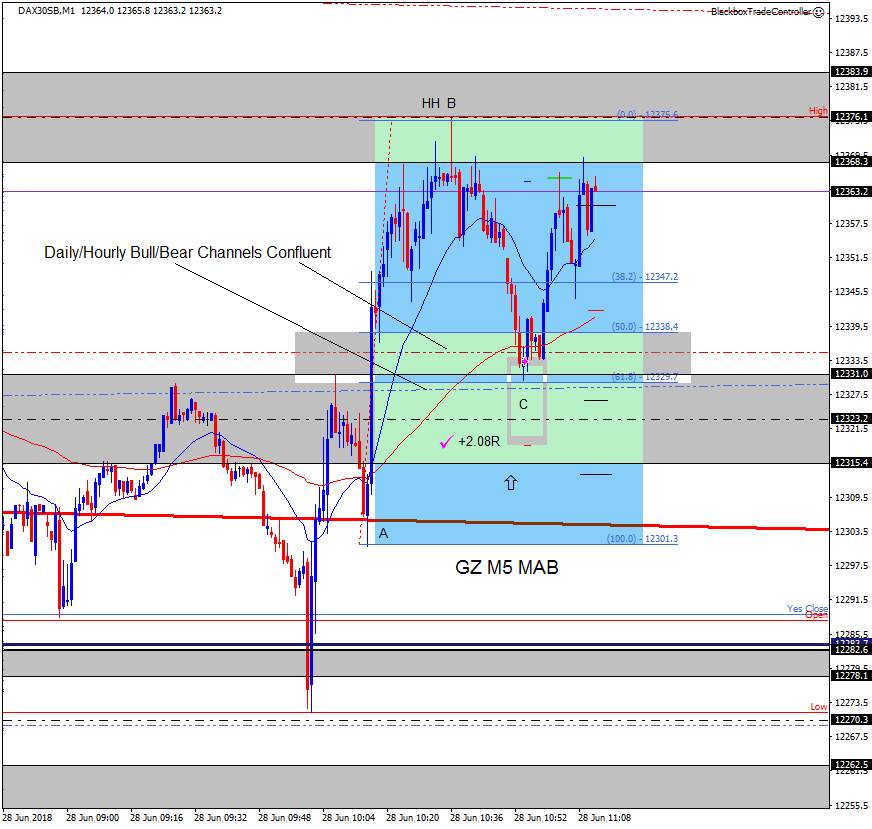
Had a late start but was in time to spot a great looking GZ M5 MAB, took it and got my +2R 🙂
I’ve not had a pure 2R for weeks due to the routine etc. so it felt good and was a 100% WTA! I knew this before I entered, that feeling I’ve mentioned a lot.
The only thing I’d maybe do differently is not have such a wide stop.
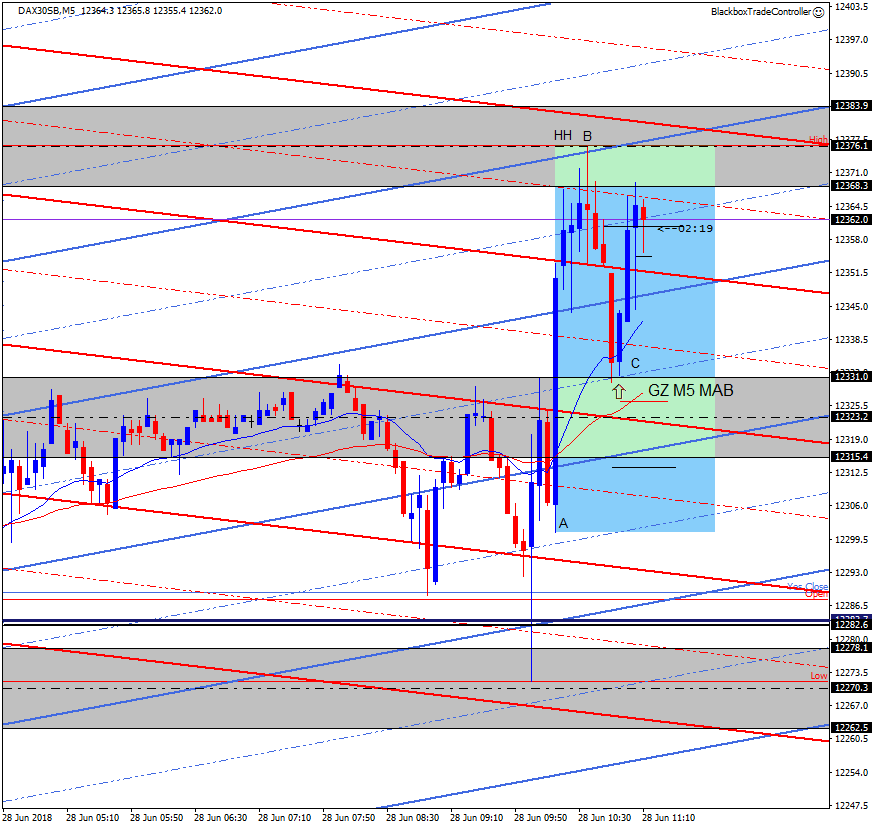
I’d also marked it up on the 5 min and 15 min charts and as you’ll see from the screenshots below they were totally supportive, thats why I liked it so much.
Here it is on the 1 min chart, note the confluence in the Golden Zone at point C.
Here it is on the 5 min chart. Note how points B and C precisely interact with Grid structure.
Here it is on the 15 min chart, note the key zones marked up.
They are vital to have in place when ‘Looking-Left’ 🙂
Ignore the FIB levels as I forgot to remove them from an earlier setup.
Point C can be seen to be perfectly on the hourly bull mid-channel level that had been resistance (Look-Left) earlier before the impulsive leg broke through it.
Wed 27th June 2018
16:05
I’m done for the day but just came in to spot this sell setup.
Please scroll down to see any other entries that I’ve added throughout the session.
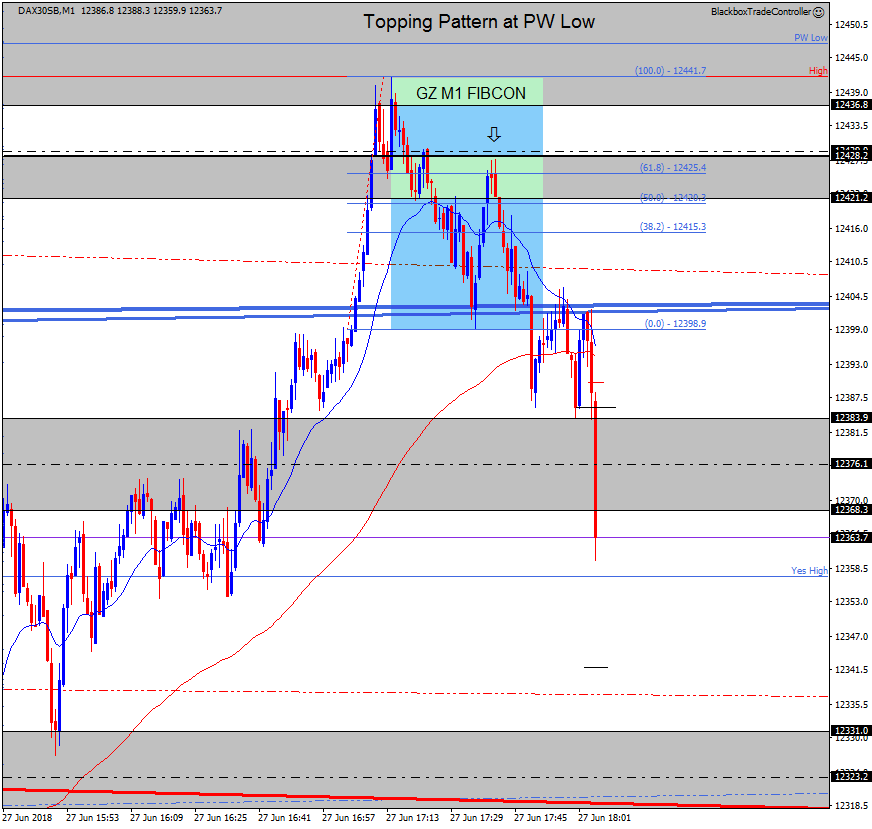
After a strong bull move up price topped out at PW Low. I wasn’t at my desk but have just come in to see a great Golden Zone M1 Sell FIBCON.
You’d only take this if you thought the price action and Grid structure supported the switch to sell mode. The higher TF charts do support this imho 🙂 but easy afterwards!
12:15
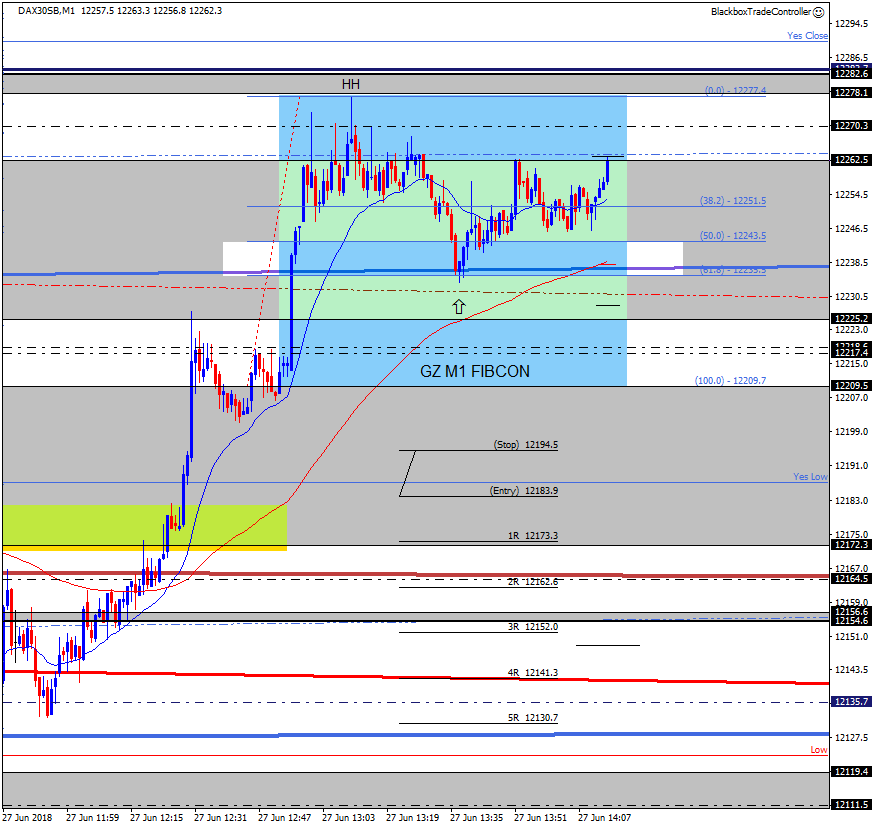
Whilst enjoying the weather the following FIBCON formed, it’s decent with points A-B-C being found precisely at Grid stucture.
A second leg up resulted in the following Golden Zone M1 Buy FIBCON. The HH was at the top of a 5 min keyzone (12277.4).
Point A when taken from the bottom of a 5 min keyzone (12209.5) resulted in a perfect 61.8 (12235.5) retrace to the hourly bull channel.
Our mission is to identify FIBCONs and MABs that have Golden Zones (ideally the 61.8 level) confluent with additional Grid structure.
We ‘Look-Left’ for Role-Reversal zones….
10:39
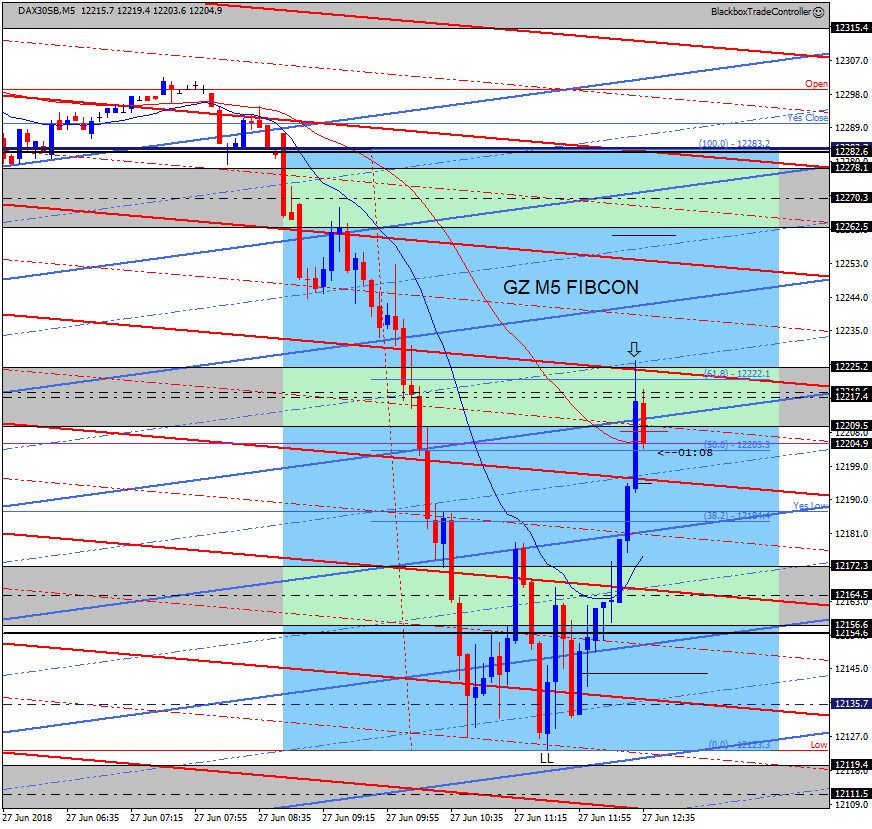
The bull spike formed a Golden Zone FIBCON which is shown below on the 5 min chart.
The 61.8 level (12222.1) was confluent with the top of the 5 min key zone (12225.2) and the bull/bear 5 min channel intersection.
The 12282.6 level is an hourly AND a daily key zone boundary so a valid point A for this type of structure.
It takes great anticipation and timing to trade these but with practice and daily repetition we believe it’s possible to master them!
10:05
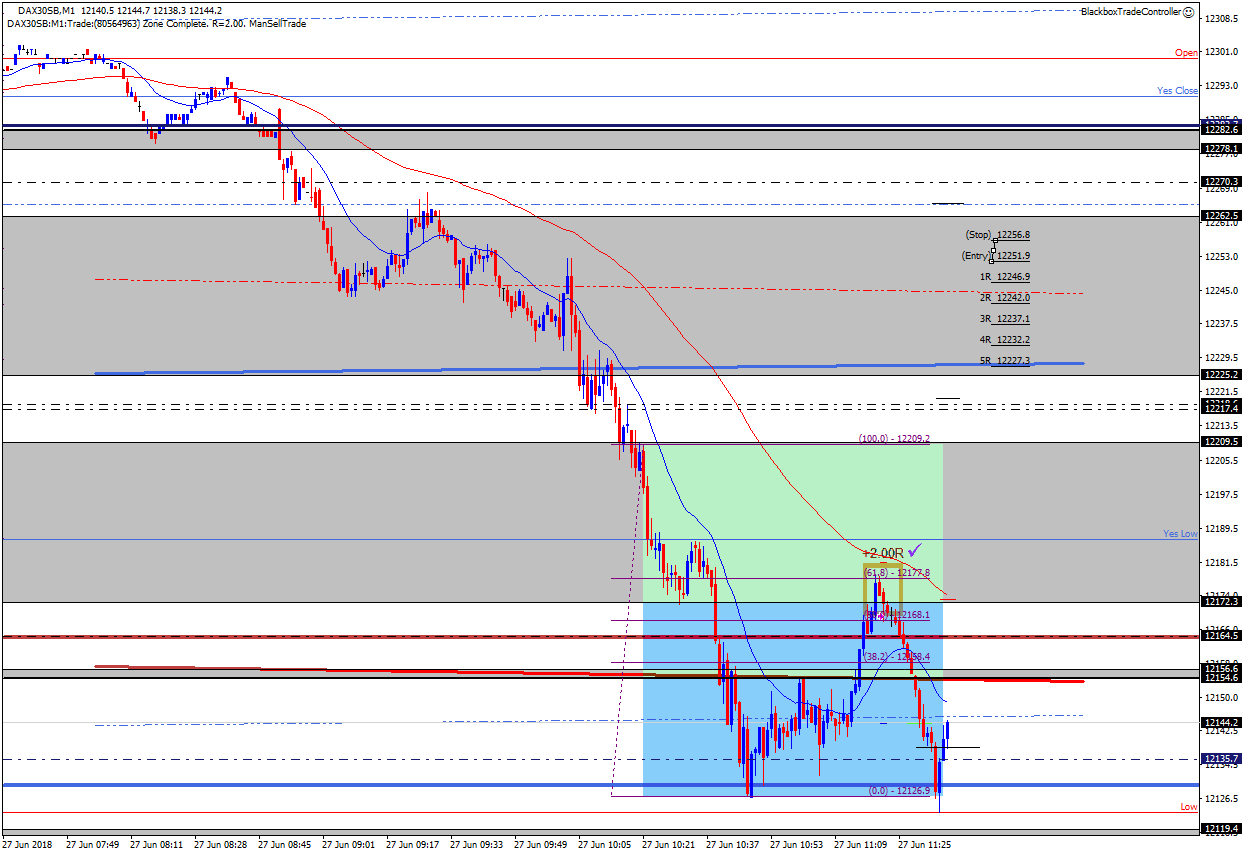
The following screenshot shows Elaine’s winning trade for the same FIBCON mentioned below.
Well Done!
09:41
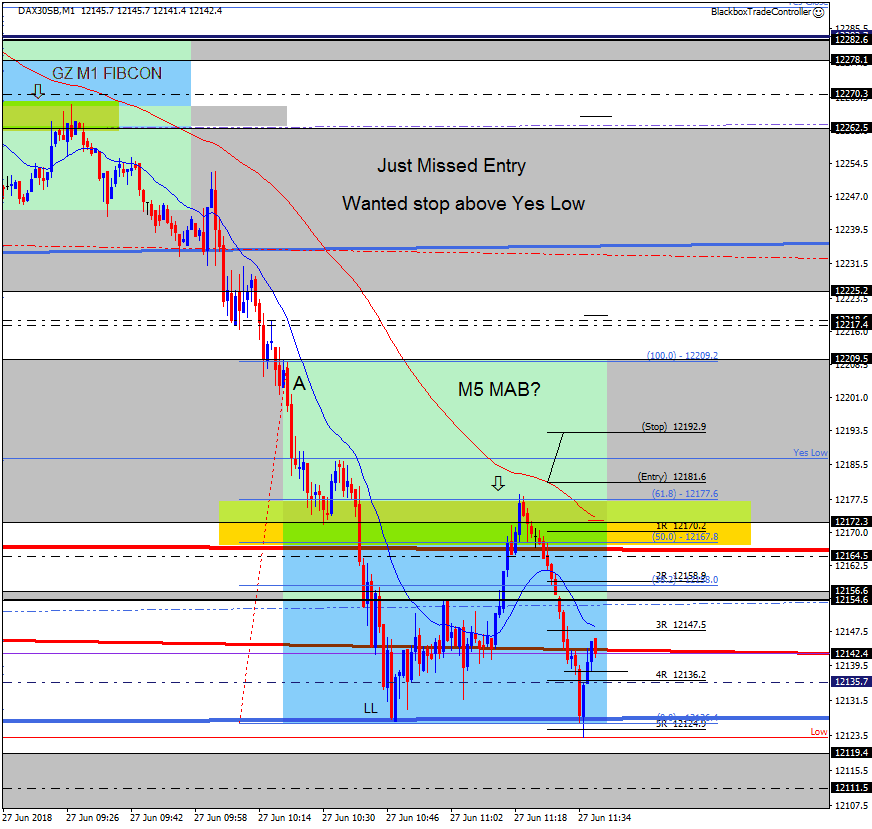
I just missed entering the sell setup because I was wanting my stop above Yes Low. If I’d also adjusted point A (12209.5) to be the bottom of the keyzone guess what?
The 61.8 level (12177.6) was exactly where price reached.
Very very happy with the read and anticipation of sell setup. Need to work on timing, however, I resisted the temptation to chase price 🙂 though on this occasion it would have worked out!
The Trade Tool shows where I was waiting….
08:55
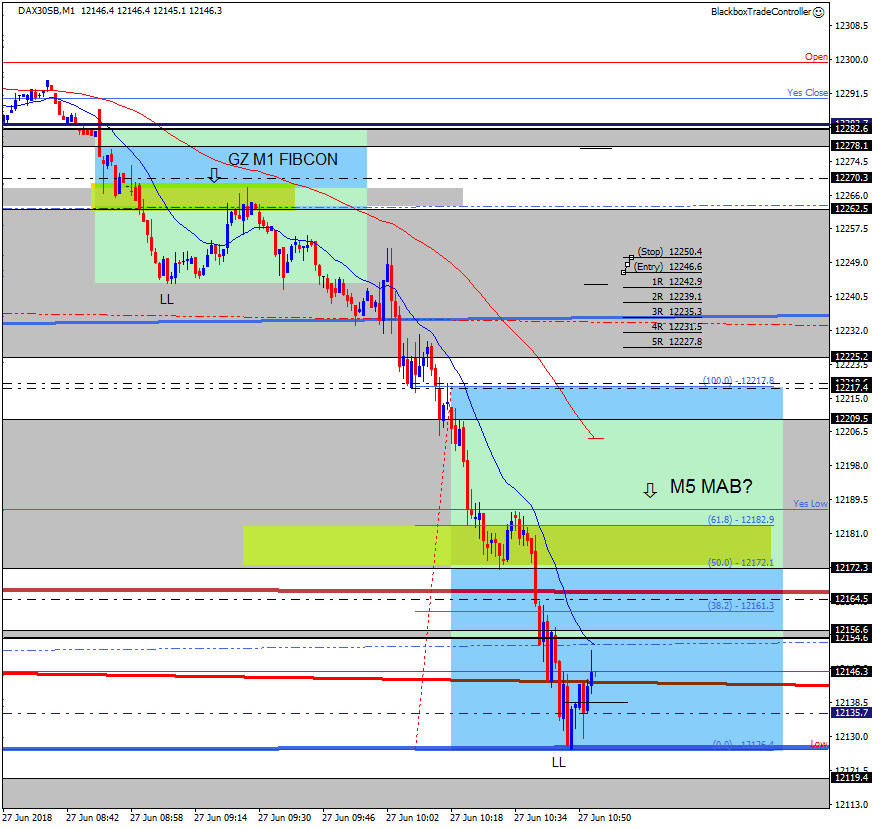
The bears are in control so the M5 MAB mentioned earlier has evolved into the following. Price is currently in a zone of SUPCON
08:34
Possible M5 MAB if price can get back above Yes Low and retrace deep enough???
Golden Zone right in middle of 5 min keyzone.
07:45
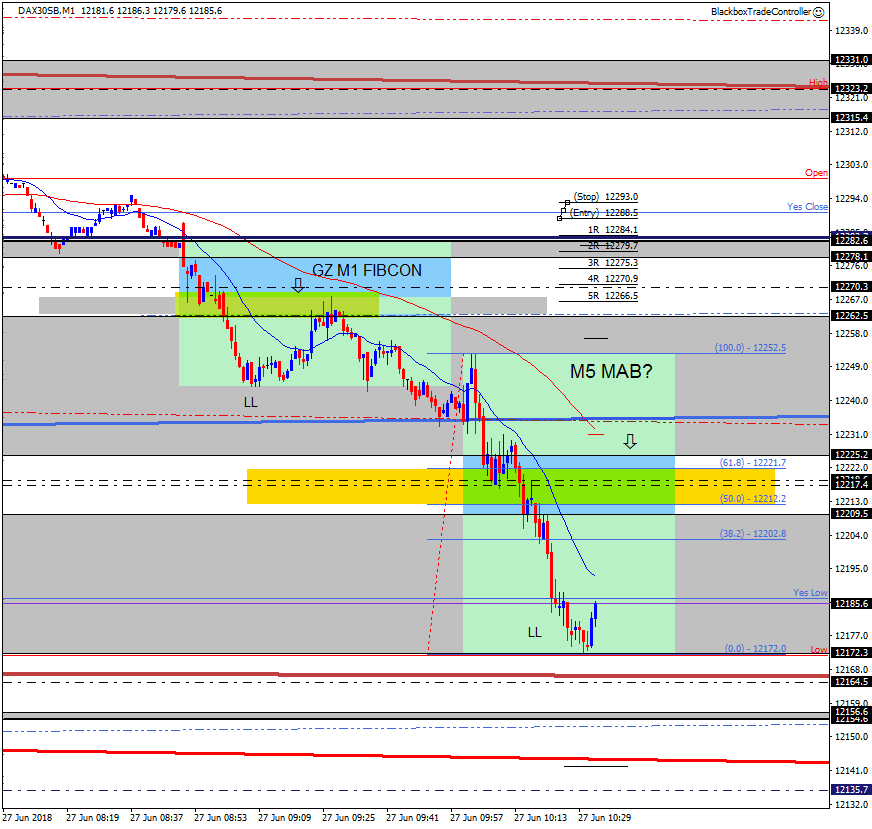
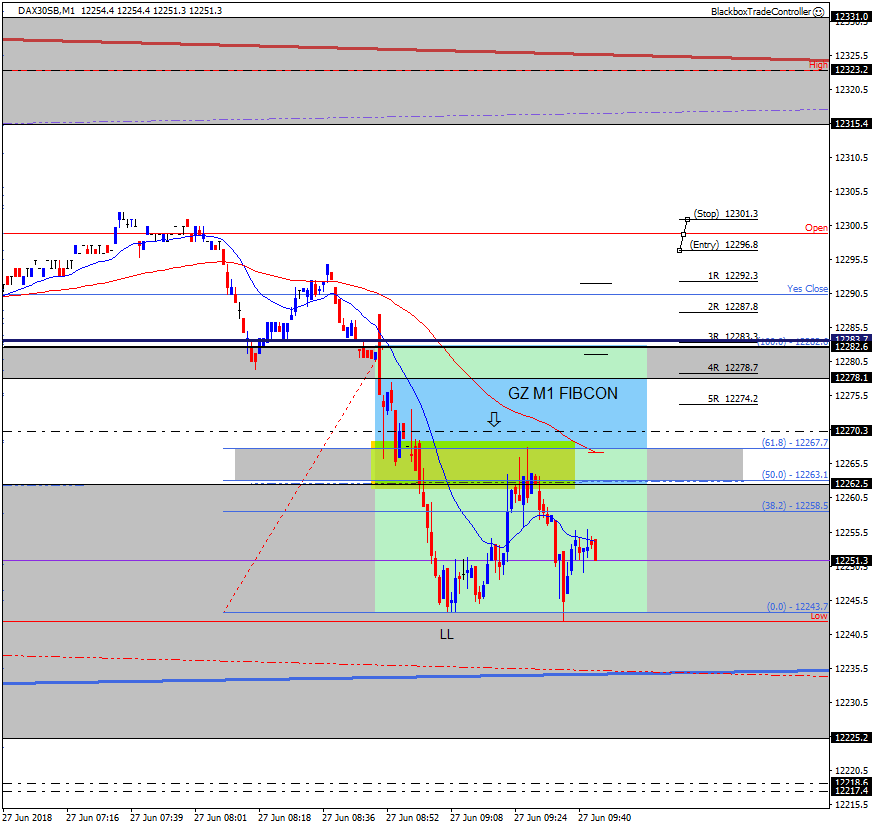
A decent GZ M1 FIBCON occurred just before 07:30.
I’ve highlighted the precise levels that the retrace reaches as a zone goes through a role-reversal (Look Left 🙂 ). When identified correctly they offer vey high value trade entries.
Tue 26th June 2018
16:47
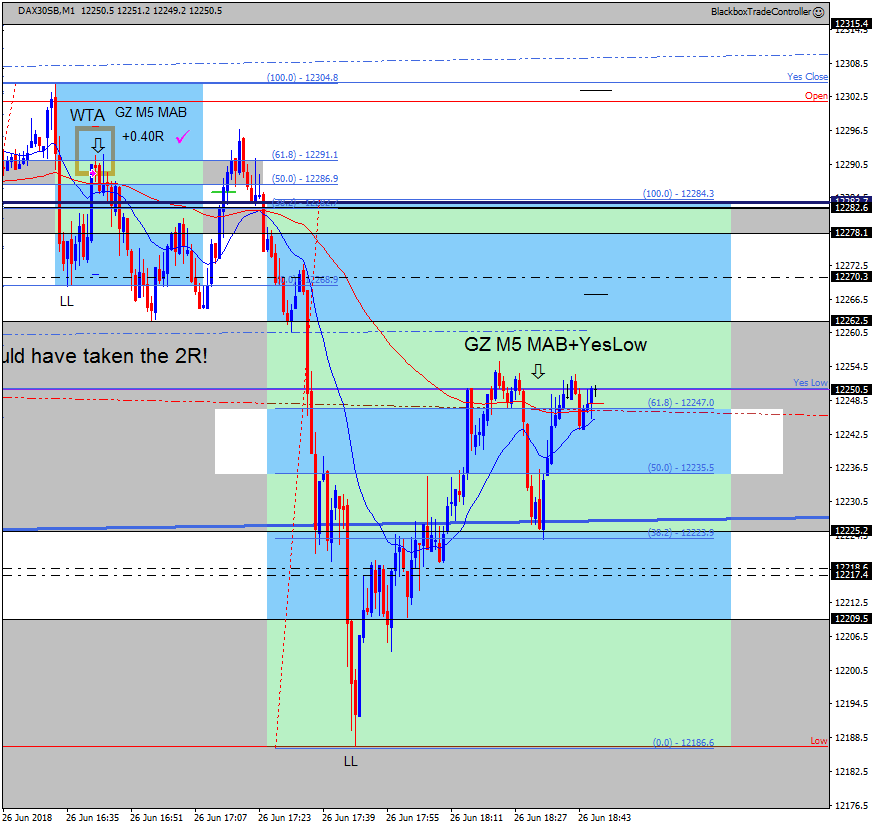
Just came in from enjoying the sunshine to seethat price had continued to sell off and in doing so formed another great Golden Zone Sell M5 MAB perfectly confluent with Yes Low.
The move back down to the hourly bull channel at 12227 was a good target.
Note that the M1 MAB at 12225.0 would have been tempting in real-time, it did cause price to reverse to the bottom of the keyzone but then reversed again.
I’m sure I would have taken the M1 MAB as it would have looked good in real-time.
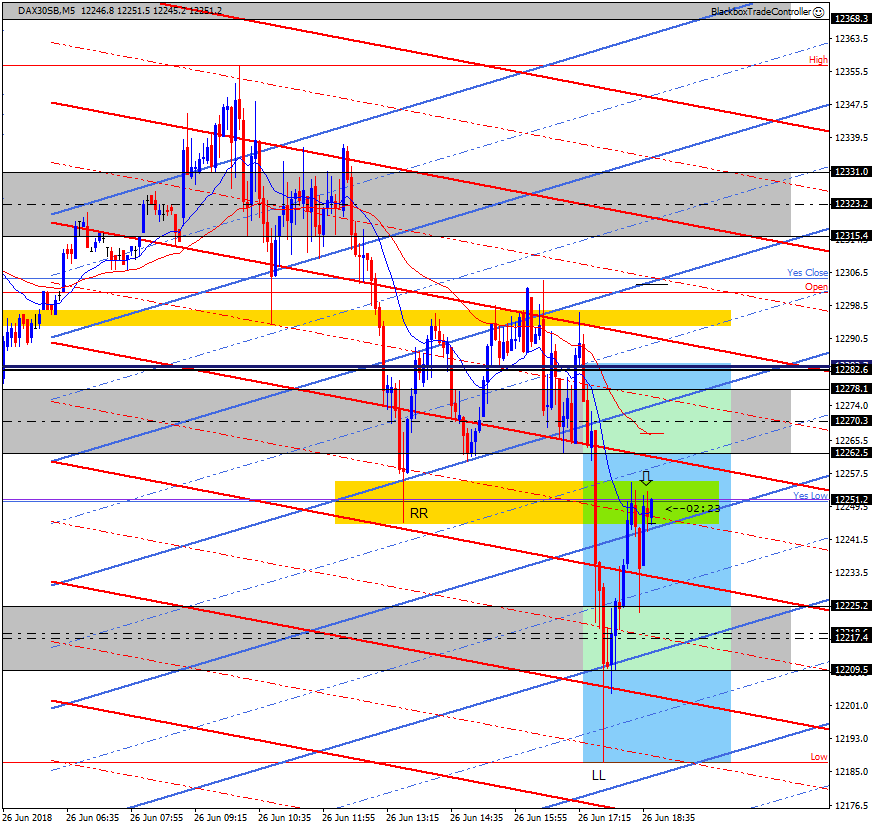
Below shows the same setup on the 5 min chart. Once again the quality of the setup stands out when you ‘Look Left’ to see the earlier wick that marked what was to become a Role-Reversal zone.
These great setups display a consistent pattern of structural confluence, let’s filter all except these!!!
15:16
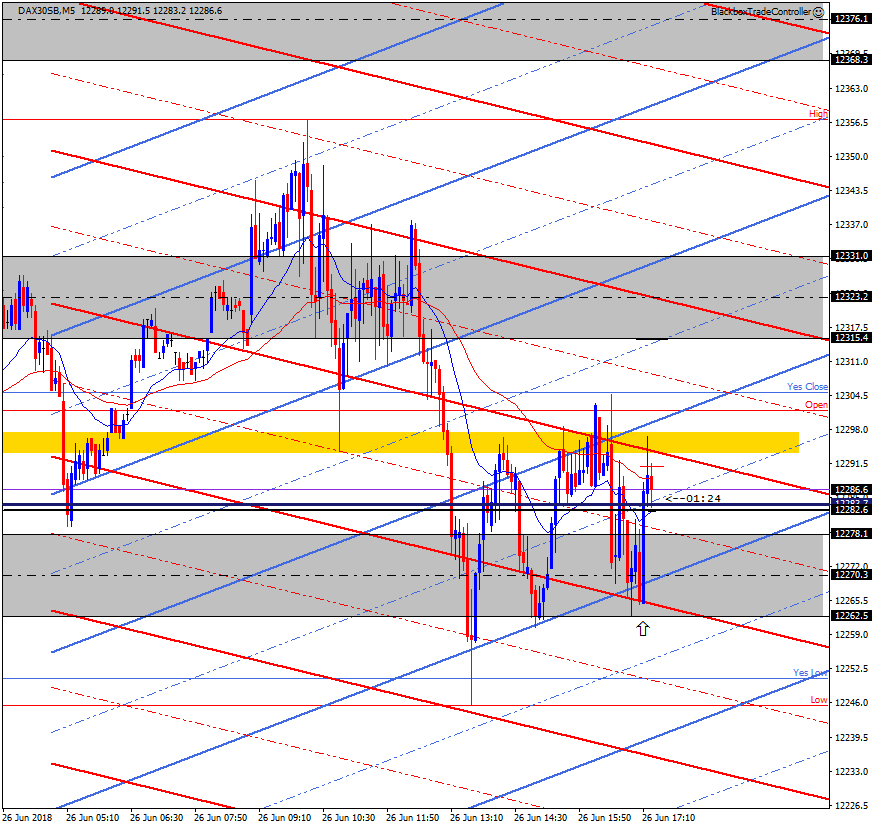
A winner at last but got greedy instead of taking 2.60R off the table.
I moved my target hoping for more after the bearish few days but today of course it didn’t play out. It’s a WTA for sure, I liked the A-B leg off the Open that setup the 61.8 level at 12291.1
The 5 min chart below shows where I should have closed out, the arrows marks the bottom of the range structure at 12262.5
Good to have a winner though not a day – so far – when the bears are selling each retrace and driving price lower. The market is consolidating after such a bearish few days, when the market is consolidating it will tend to range, which is why I should not have moved my target below the 12262.5 level.
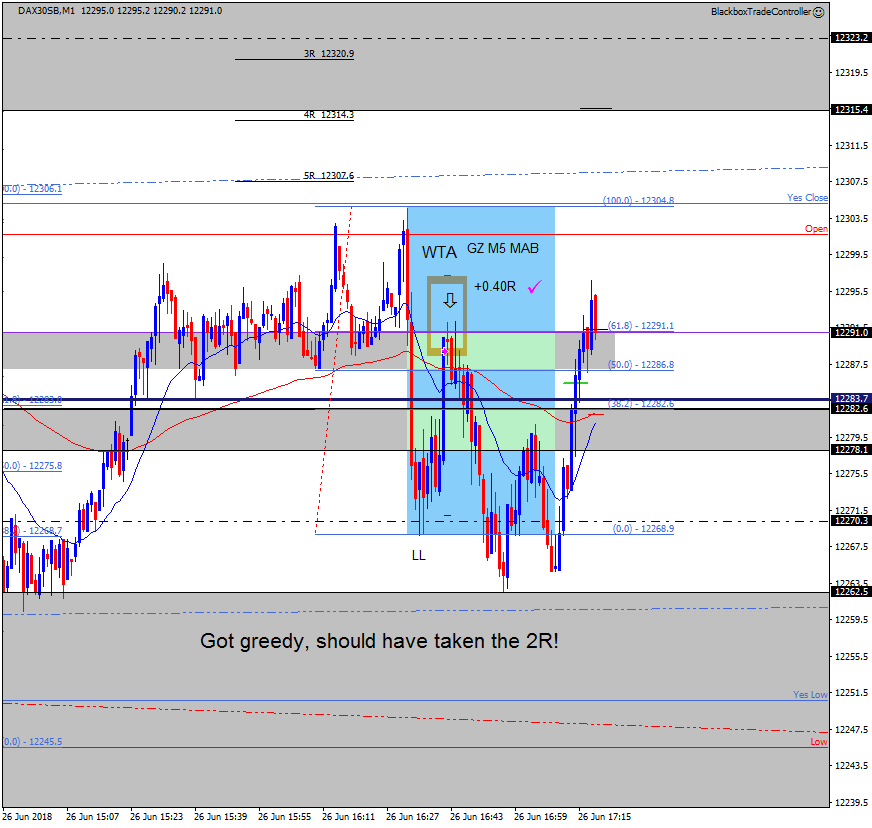
Below shows where the realistic profit target was based on Grid structure.
12:17
Just had a loser, I liked the setup and the only thing I didn’t like was price was bouncing up off Yes Low, effectively a double-bottom from yesterday.
I moved my stop 🙁 to cover the M5 MAB and an area that may have functioned as a barrier but not this setup.
Structurally I liked it, WTA but was too early. Price came up to where I’d moved my stop to which was above the 61.8 and M5 MAB.
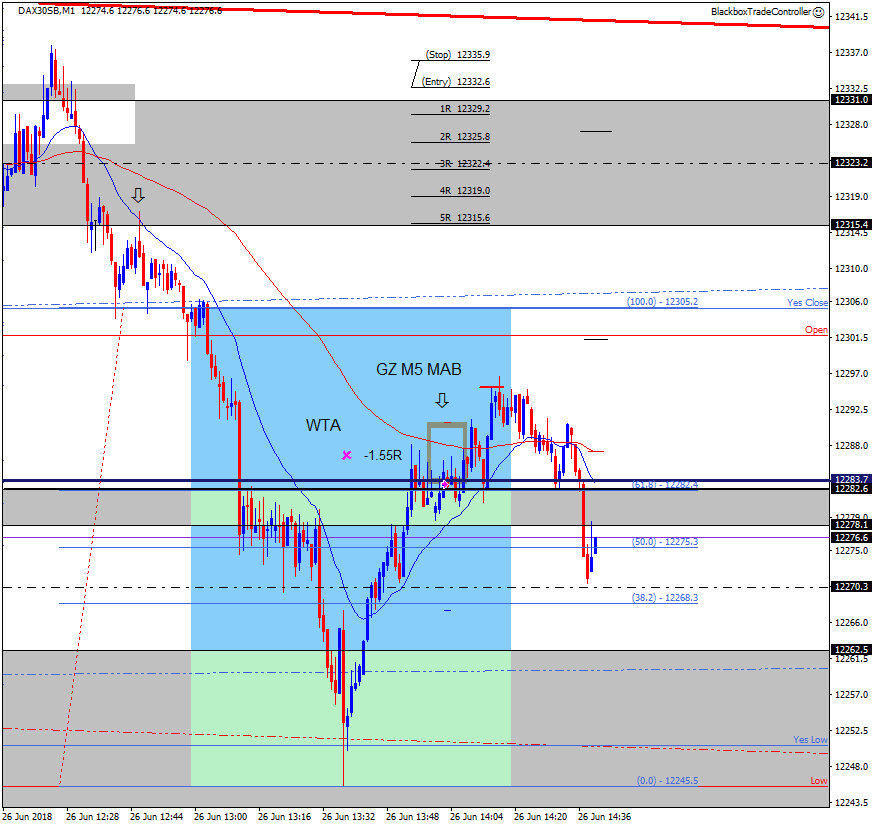
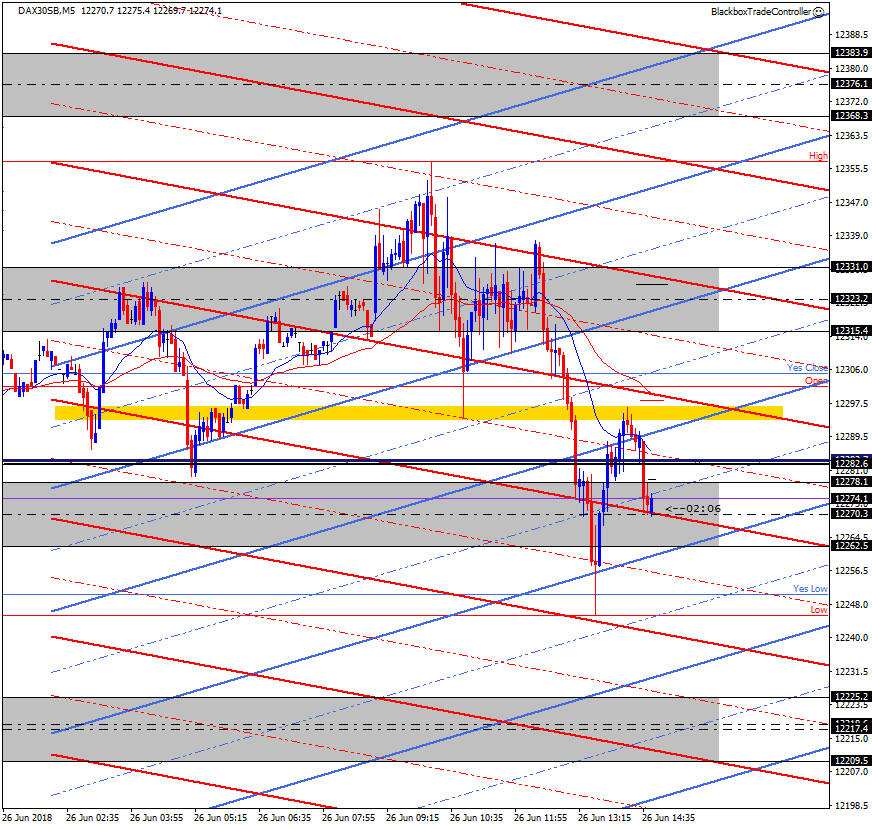
The following 5 min chart shows why the trade I took failed BUT also why the setup was a sell. I did move my stop to the bottom of the golden zone but not the top which is where price reached!!!
A great sell setup, my entry was way too early as I’d missed the golden zone shown.
An example of how important it is to ‘look left’ when determining point C.
09:58
The screenshot below is taken from the 4 hour and shows how price had sold off from point A to point B, starting just above and ending just below the daily key zone boundaries.
If price does bounce back up then maybe the Golden Zone that encloses the PW Low may come into play?
The 4 hour MA and previous wick that formed the PW Low will add their energy to the stream of confluence maybe? Also note that the 50.0% level is confluent with an hourly keyzone boundary (12428.2).
To reach it price will have to push up through some channels boundaries.

09:35
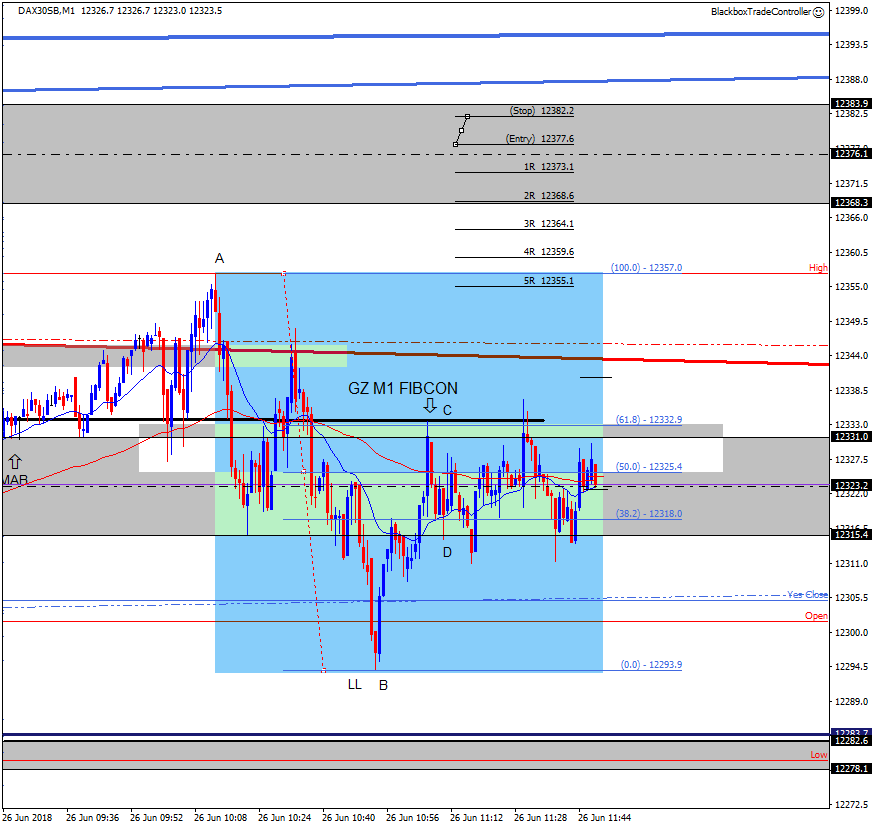
The following GZ M1 FIBCON was a good setup and worth a comment.
The 61.8 level was just below the top of the 5 min keyzone at 12327.4 when you take point A from the hourly and daily bear channels.
When you look to the left the previous wicks suggested it might want push up through the 61.8 level which it did until it reversed down to point D. I’ve used a black line to show that when price reversed it was doing so where it had used this level in the last hour or so as shown by the previous wicks.
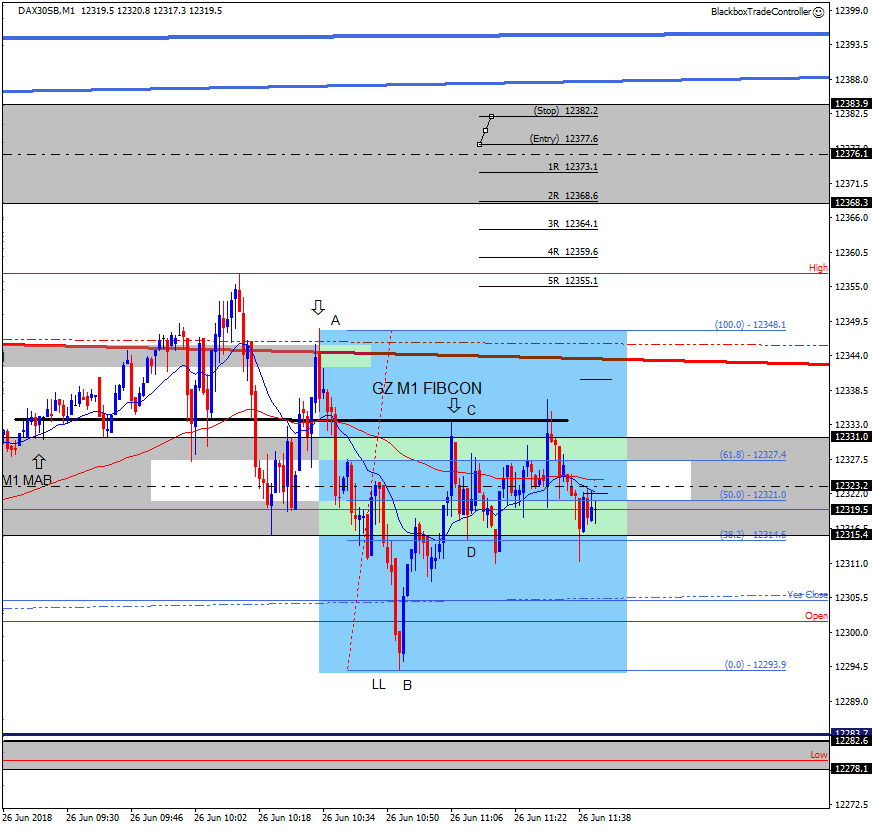
Tough to trade but the core structure was there. Also, if you took point A from the High the 61.8 level is perfect.
Wished I’d taken it!
08:42
Back at desk this morning after the weekends ride and recovery 🙂 We had a great trip down to Hartlepool Marina, wonderful weather and scenary.
From now on the latest blog update will be at the top of the page.
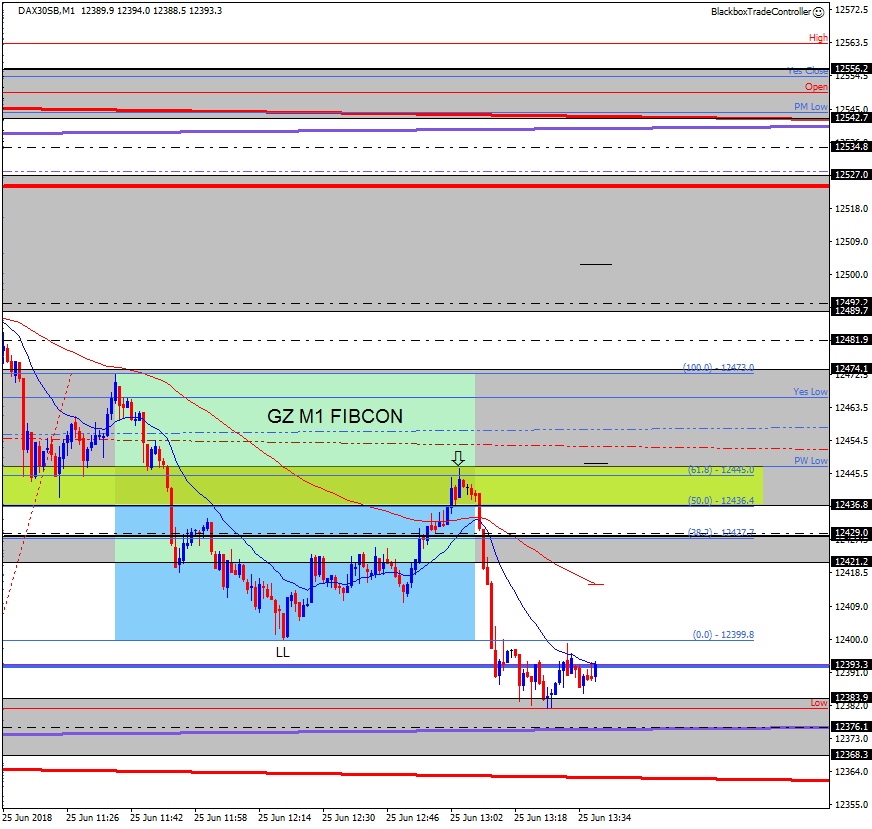
Yesterday I did mark up a great M1 Sell FIBCON that reached the PW Low and the 61.8 before selling off.
The following screenshot was taken yesterday.
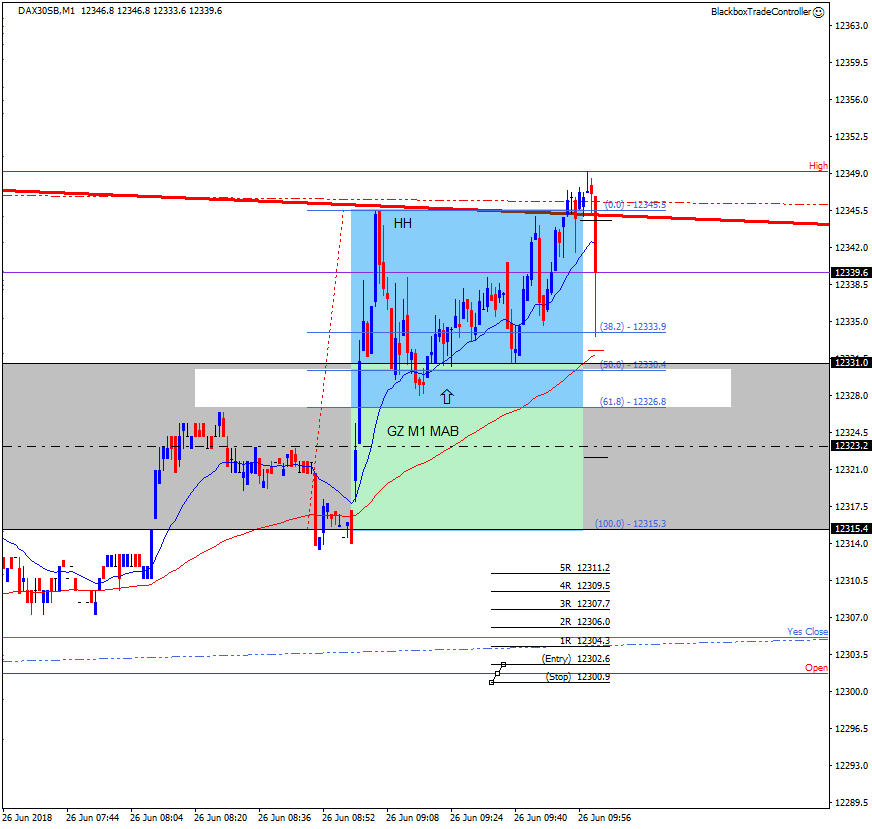
Today has been a bit rangy after more selling yesterday.
There was a pre 8am M1 Buy MAB earlier back up to the hourly & daily bear channels.
Wed 6th June 2018
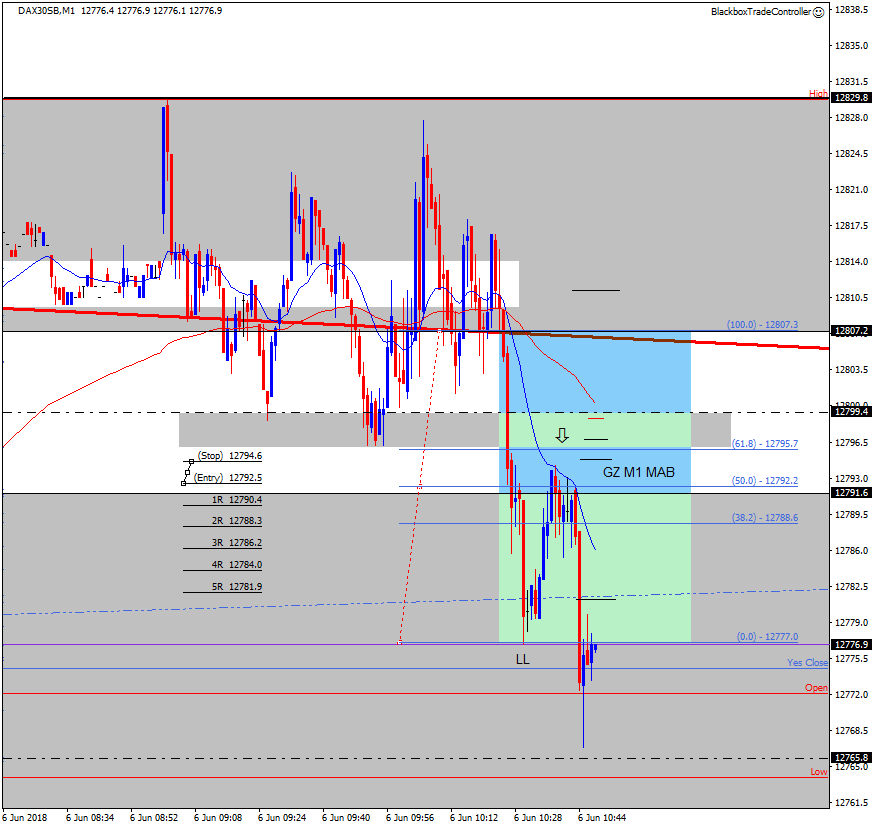
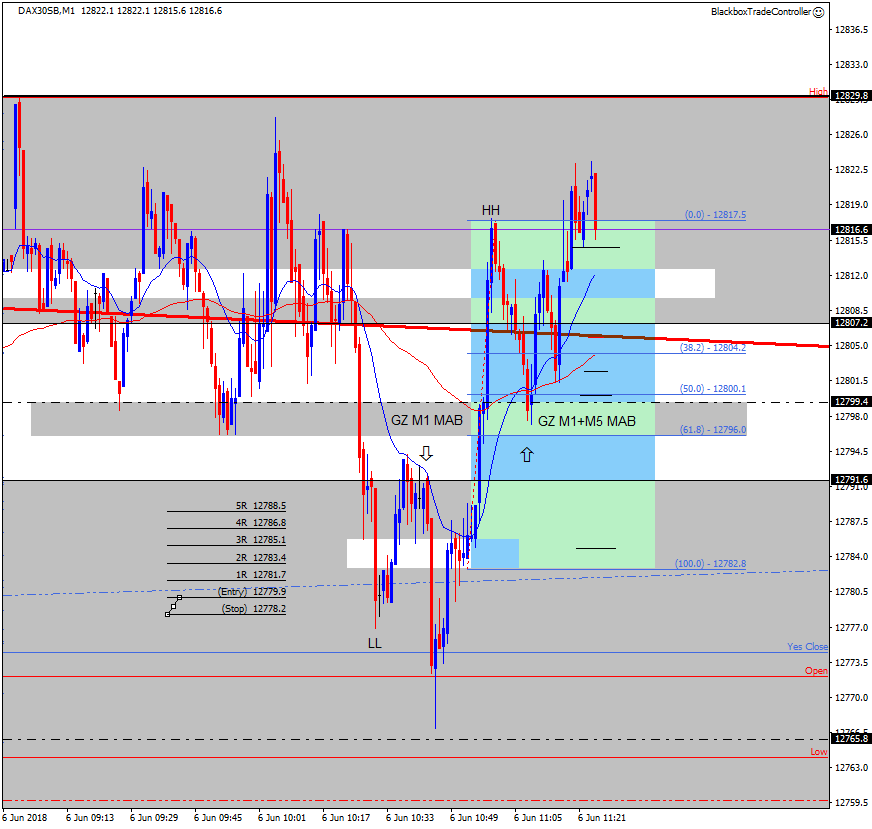
Off to Scotland the day so packing this morning. Just spotted the following sell M1 MAB, was not at my desk but I like to think I’d have taken it, it’s a decent setup after a spikey London open.
The impulsive A-B leg that produced the LL clearly stands out, that’s what drew my attention to it when I looked at the chart.
09:25
Just having a coffee break and noticed a buy MAB after the spike up to form the short-term HH.
A tough trade to take as price is ranging, however, the golden zone I’d already marked up from earlier and the 12800 level provided support along with the M1 and M5 MA’s.
I’m not sure I’d have taken as I think I would have talked myself out of it.
Thu 7th June 2018
11:50
It’s a wonderful June day in Greenock but due to change tomorrow.
We’ve had broadband problems so am currently using my mobile as a hotspot. I’m not trading today but did notice a superb M5 MAB at 09:53.
It had a clear impulsive A-B leg to form a LL, point C was perfectly confluent with the 61.8 at 12874.5, the hourly bear mid-channel, the daily keyzone boundary at 12873.5, just below the hourly bull channel and last but not least the M5 MA.
Also note how the 5 min chart shows the bear channel acting as resistive confluence.
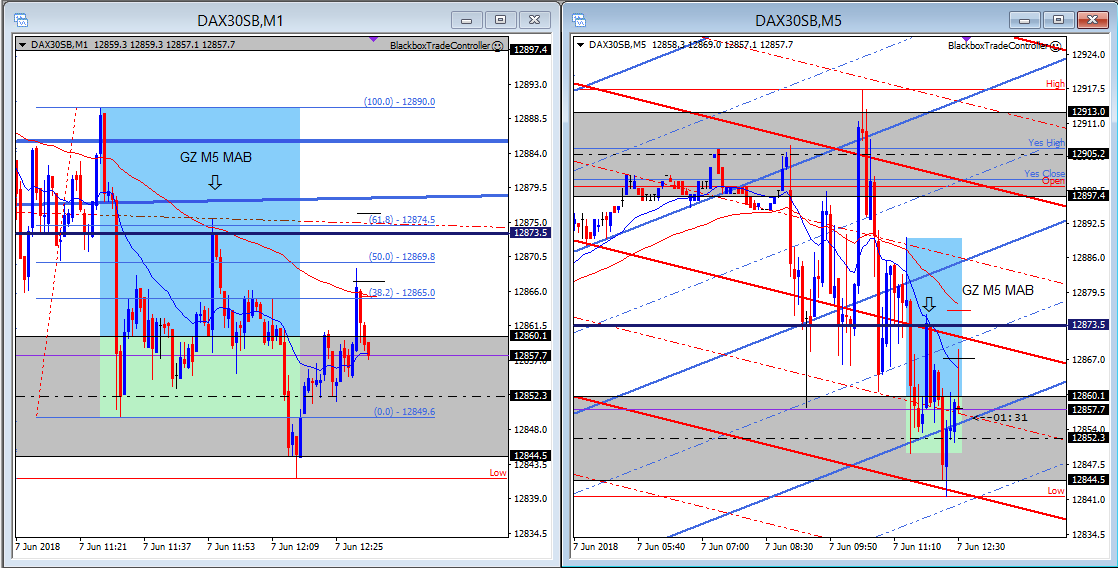
I’ve just noticed another superb M5 MAB that formed at 10:50. Not such a standout impulsive A-B leg but still a LL with point C confluent with the 5 min keyzone boundary at 12860.1 and the M5 MA.
This is a good example of how the earlier M1 MAB at the mid-line (12852.3) was not structurally a value setup, the M5 MAB was clearly a value setup.
14:10
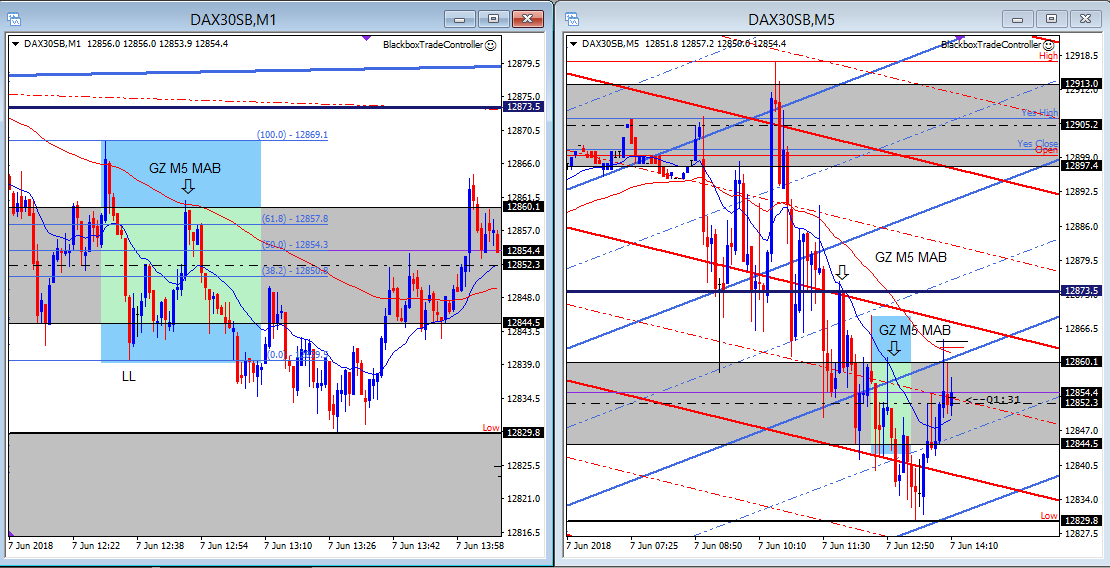
I’ve just looked at the charts to see yet another high quality M5 MAB that took place at 13:48.
Once again the M1 MAB was structually poor value, it was the M5 MAB at 12844.5, the 61.8 and the 5 min keyzone boundary that offered the value.
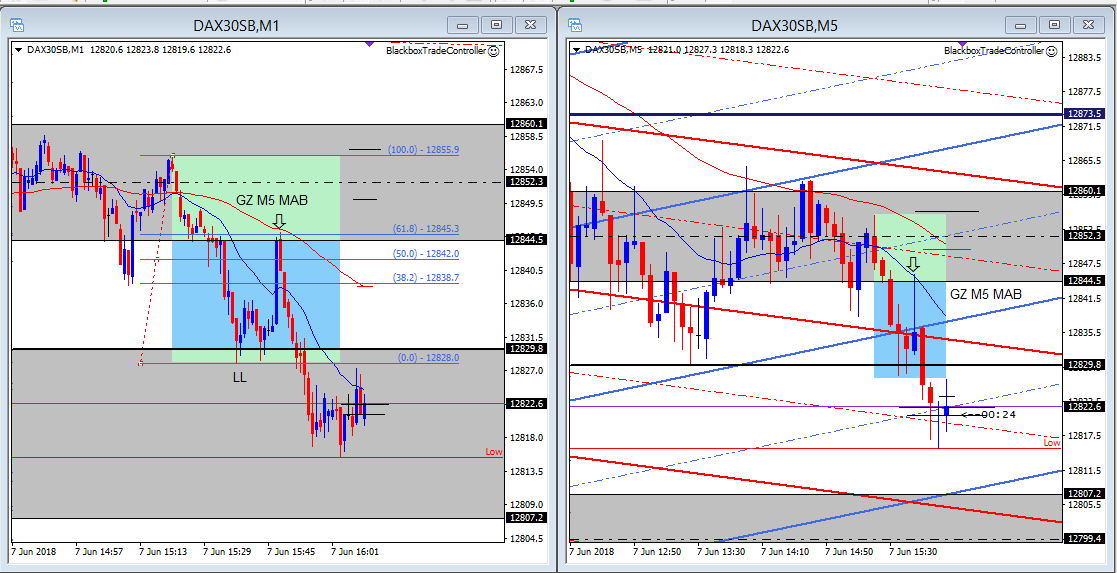
It’s always easy afterwards but how cool if you can ‘Be The Bear’ and wait patiently for such high value setups 🙂
In real time it wold have been tempting to enter the M5 Sell MAB at 11:41 but even if you did then the traders equations saves the day. Potentially 3x2R winners – 1x1R = +5R 🙂
I’ve just noticed it was followed by decent M15 Sell MAB at 12:00
Fri 15th June 2018
11:50
I’ve just noticed the bear spike down below 13103, good call so far.
The first LL at 10:57 provided point B for either the M1 or M5 MAB that followed, the best value was the M5 MAB at 11:16 at level 13109.0
The next LL was followed by an M1 MAB that was a GREAT sell structurally because it was using the first LL as a Role-Reversal level at 13086.6
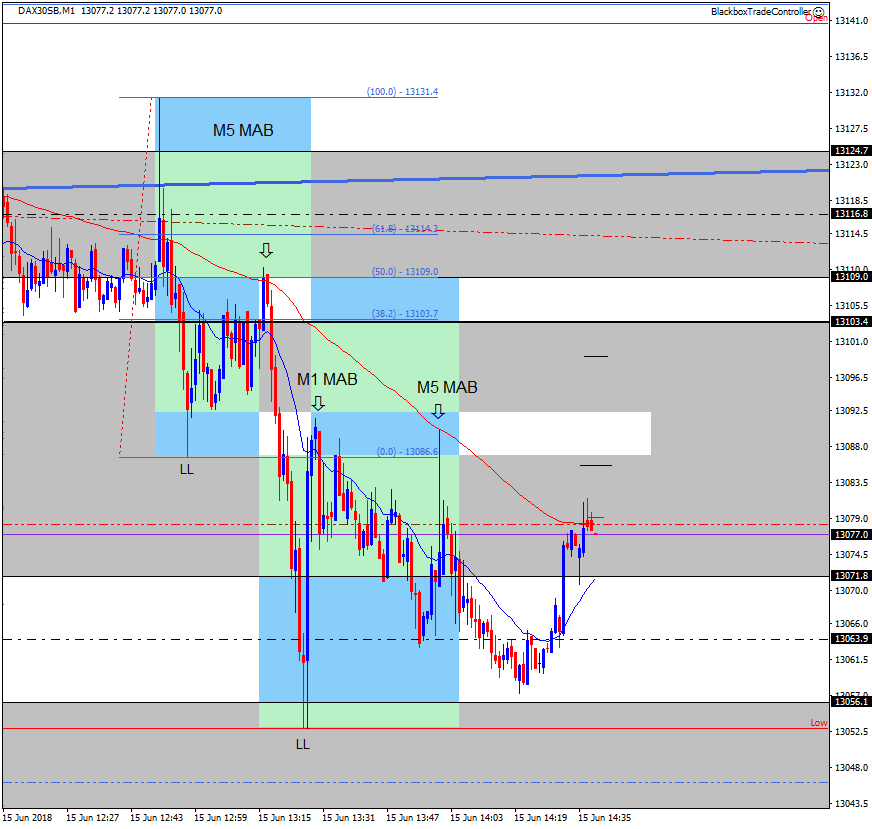
Good luck today, would like to have traded yesterdays bull spike day that followed the FOMC Wednesday evening.
Note how well the Grid captured yesterdays bull candle, after moving up all day it topped out at 13167, confluent with the bottom of the daily keyzone and the daily bull channel
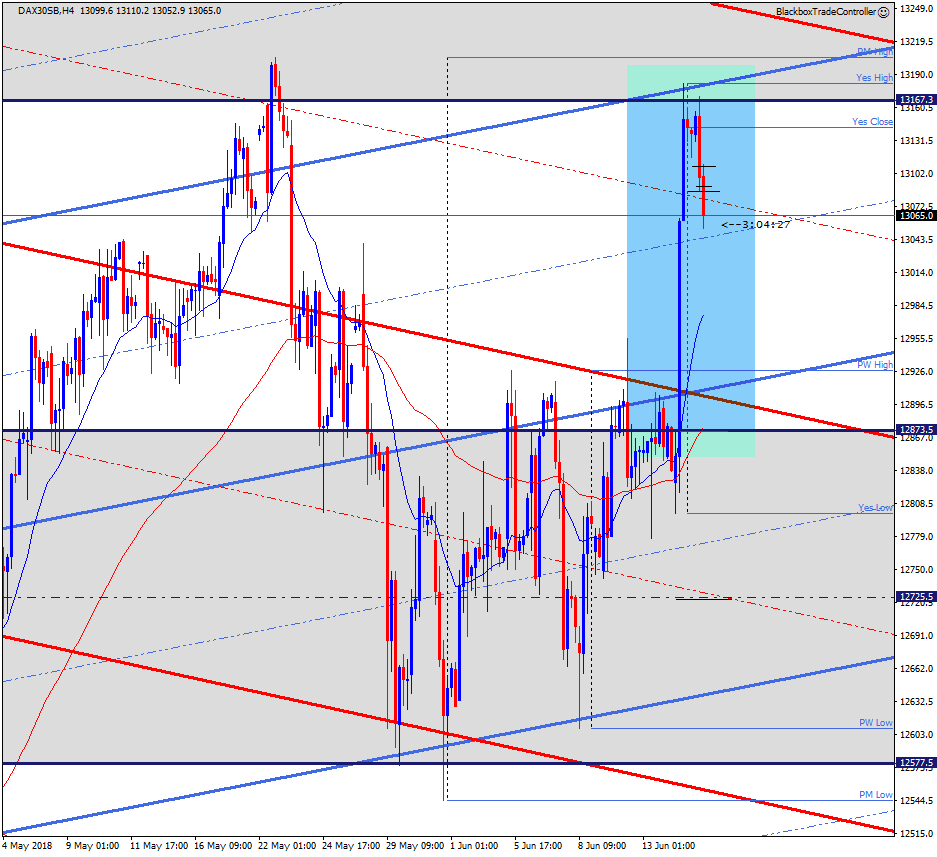
Structurally the question is “Was yesterdays bull spike for real, if so how deep is the correction before another leg up”
Blackbox are going to have a crash day since it’s too windy for a ride and we’ve got plans this weekend, a day of relaxing is called for 🙂
Mon 18th June 2018
07:50
Just had a +0.40 sell M1 MAB winner but had I not moved my TP then it would have been a +2R.
Pleased to have a winner after not trading for over a week but on this occasion should have left the TP alone, look how close it was to being stopped out, it was a bull M5 channel that kept it in the trade.
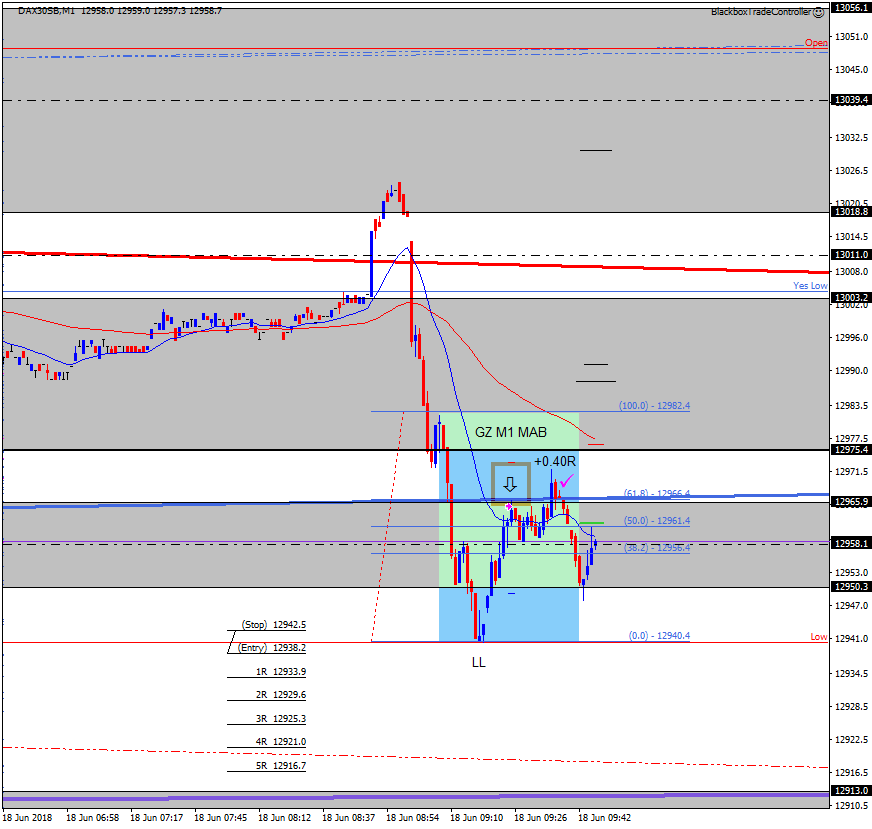
First day back at desk today, will trade this morning then plan to update blog tool.
09:57
Was away from desk and just spotted a great GZ M5 MAB sell setup!
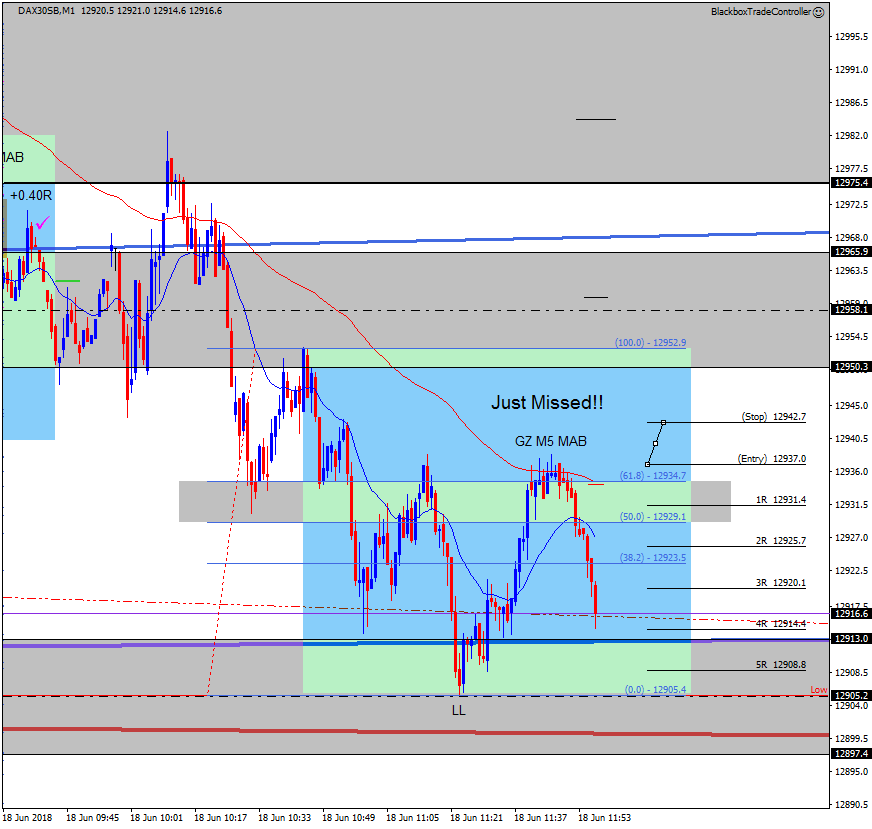
Tue 19th June 2018
10:15
Not traded this morning, at 6am I was raring to get on with the blog alert feature on the Trade Controller. It will make it easy to send alerts plus they can be automatically displayed as soon as they are detected including sound 🙂
Price has continued the sell off after last Thursday’s bull spike after the FOMC announcement. As of this morning it’s moved down two daily bull channels since it’s high last week.
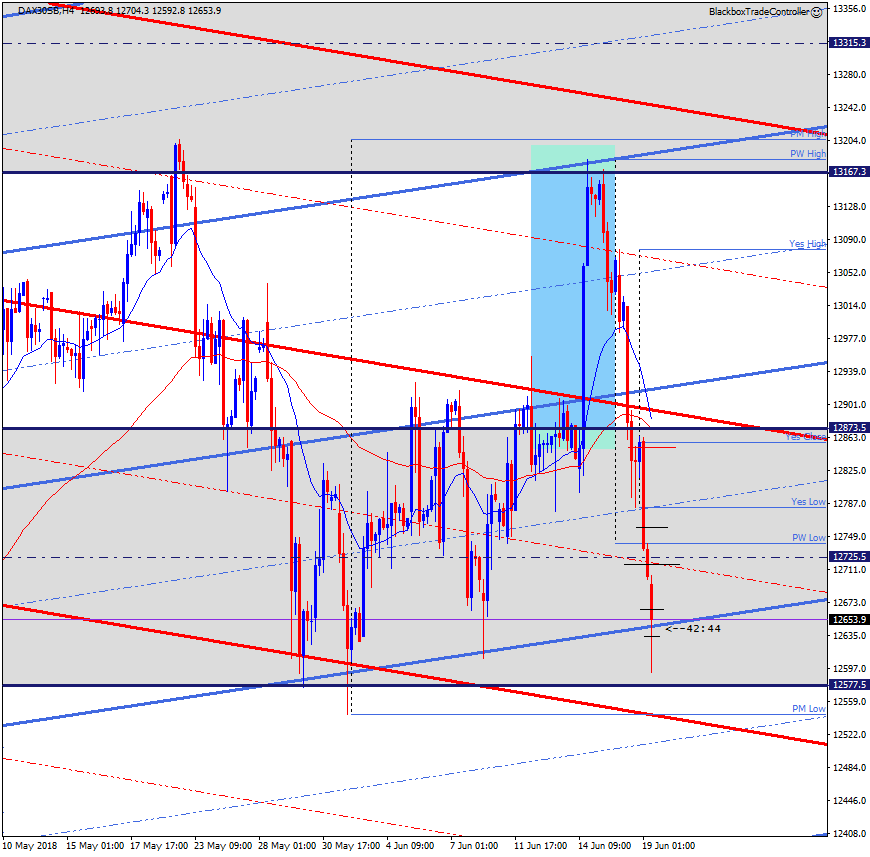
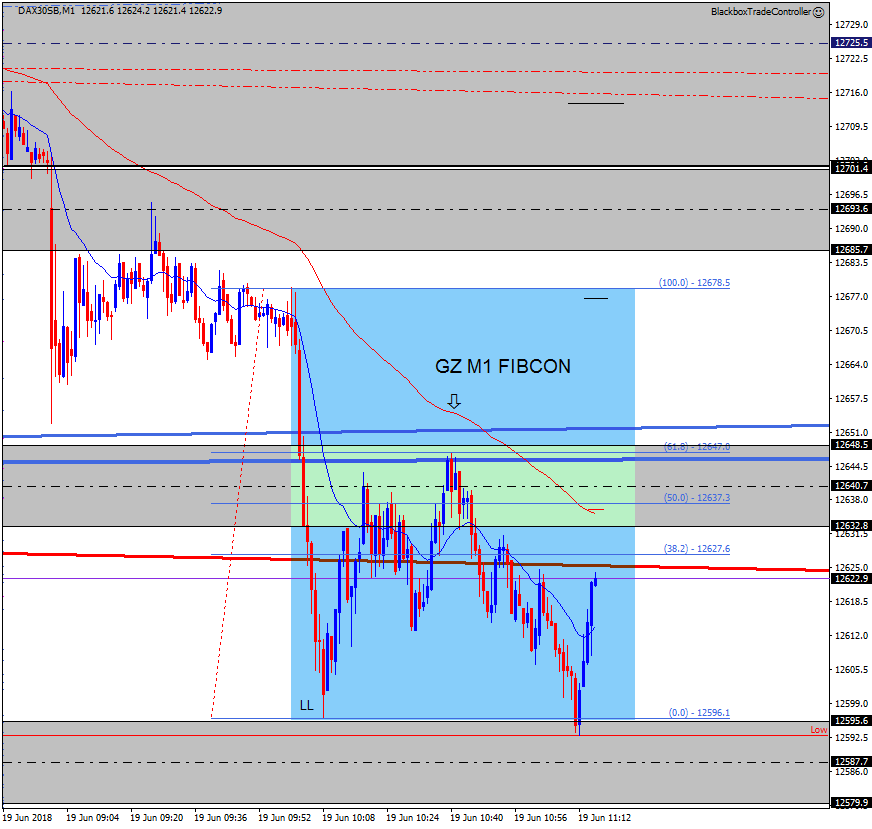
I noticed the GZ M1 FIBCON at 08:39 after the London bear spike. Tough to trade but the 61.8 level offered best value at 12647.0 and it was confluent with the daily and hourly bull channels.
Below is a video on how to use the blog update/alert tool.
Wed 20th June 2018
09:35
I arrived at my desk at 08:30 due to a poor nights sleep thanks to a migraine that came on late last night.
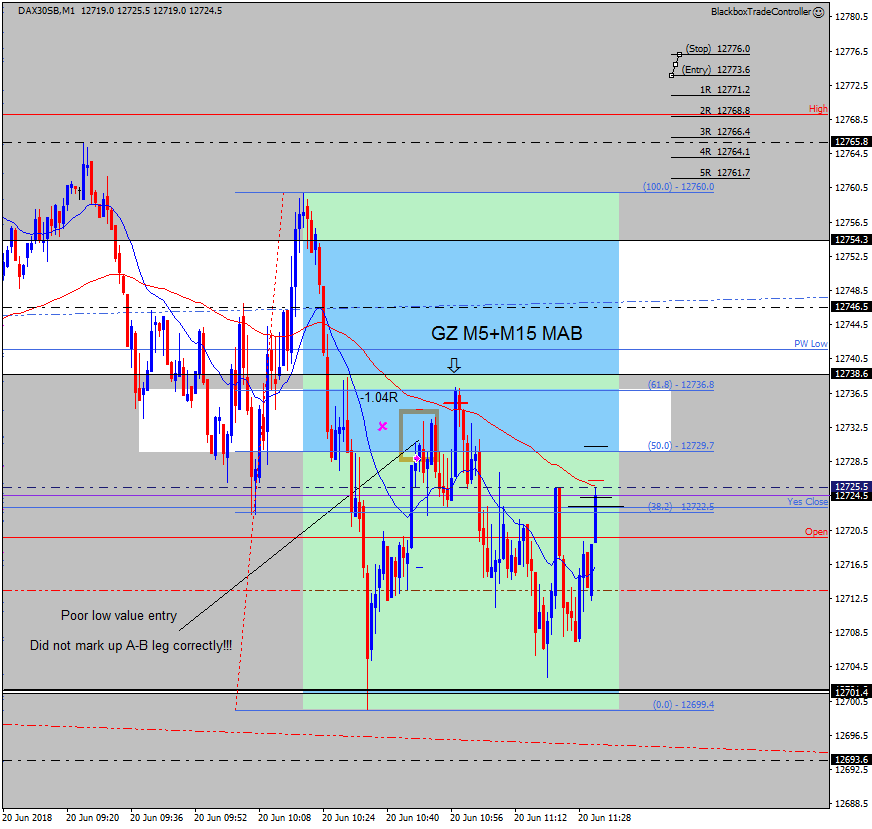
It’s still active so was not planning to trade BUT ended up taking a sell trade that resulted in a loser. The setup was good but I did not mark up point A correctly at 12760.0 so entered too early.
Note how perfectly price retraced to form point C at 12736.8, it was also an M5 + M15 MAB!!!
I’m going to blame my lack of precision on brain fog 🙂 because the more I looked at it afterwards it was a superb A-B-C setup as shown.
I’m also pleased I did not move my stop but on this occasion it would have kept me in the trade.
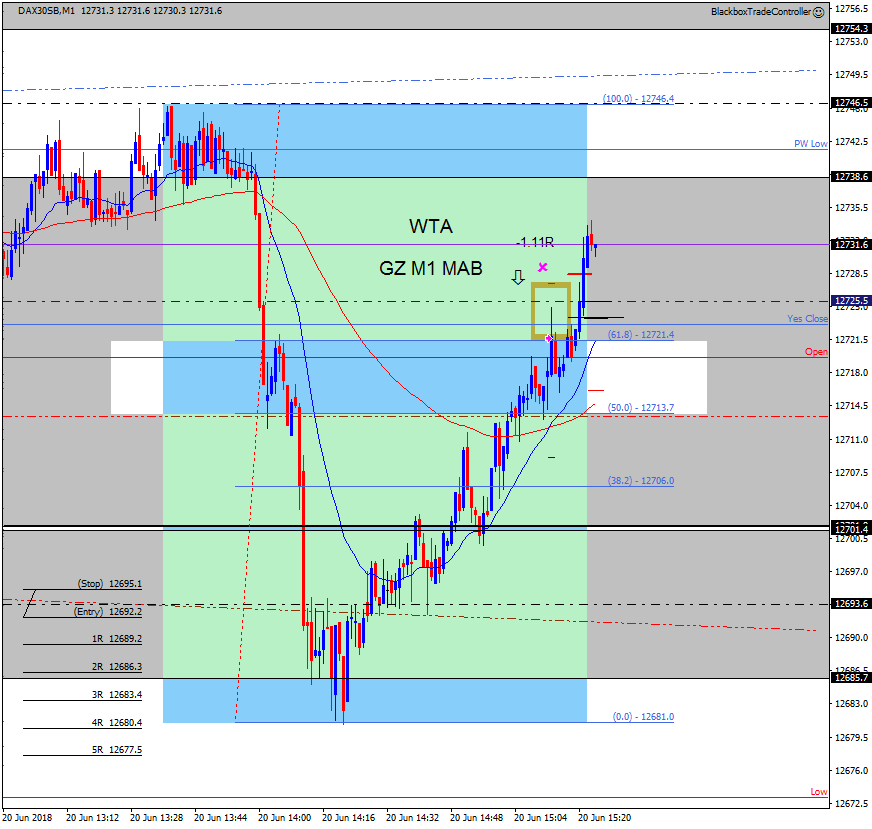
13:05
Interesting sell setup maybe???
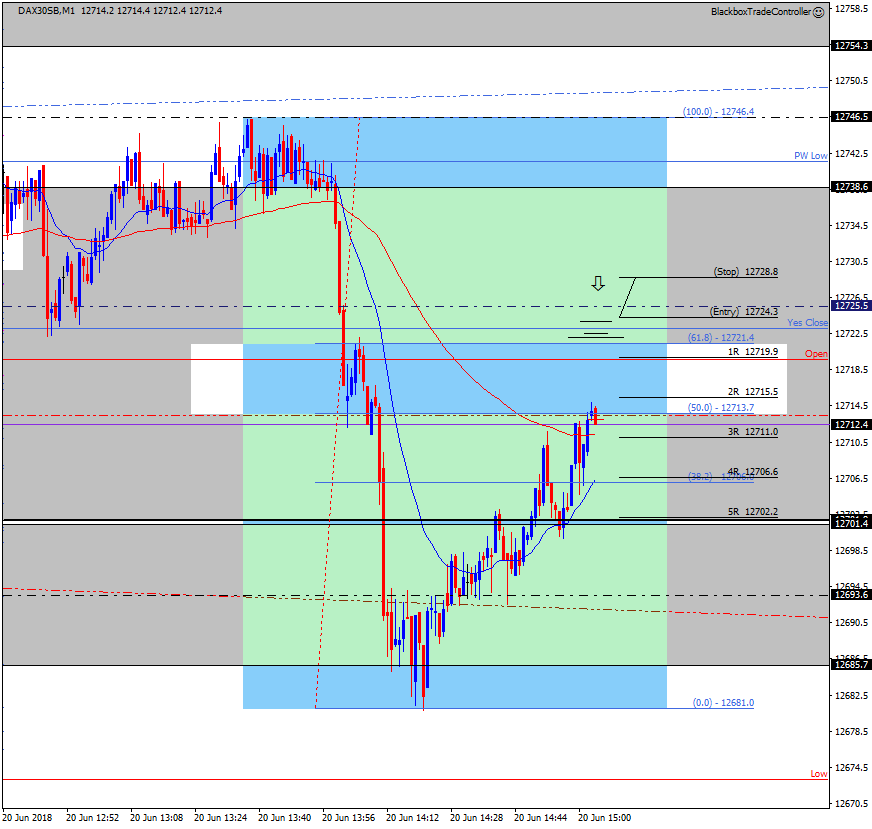
Did not work out but Would Take Again. Structure on the 5 and 15 min charts were also supportive.
Thu 21st June 2018
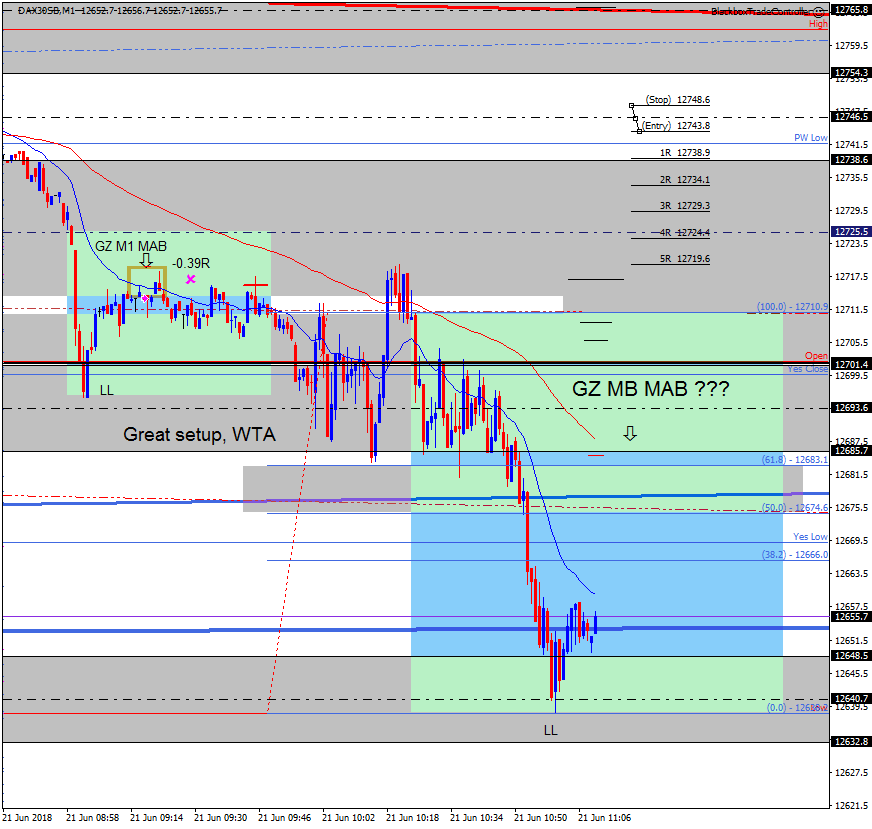
09:11
Interesting M5 MAB maybe??
It might not pullback that far but there’s good confluence if it does.
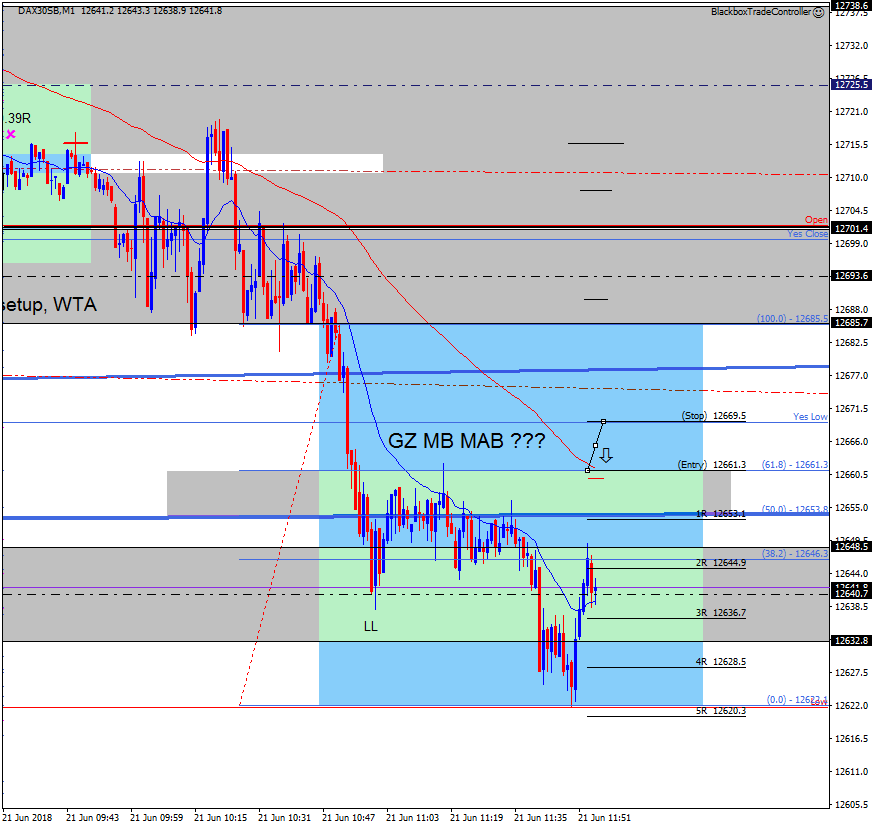
09:32
Another take on the setup with the M5 MA moving down???
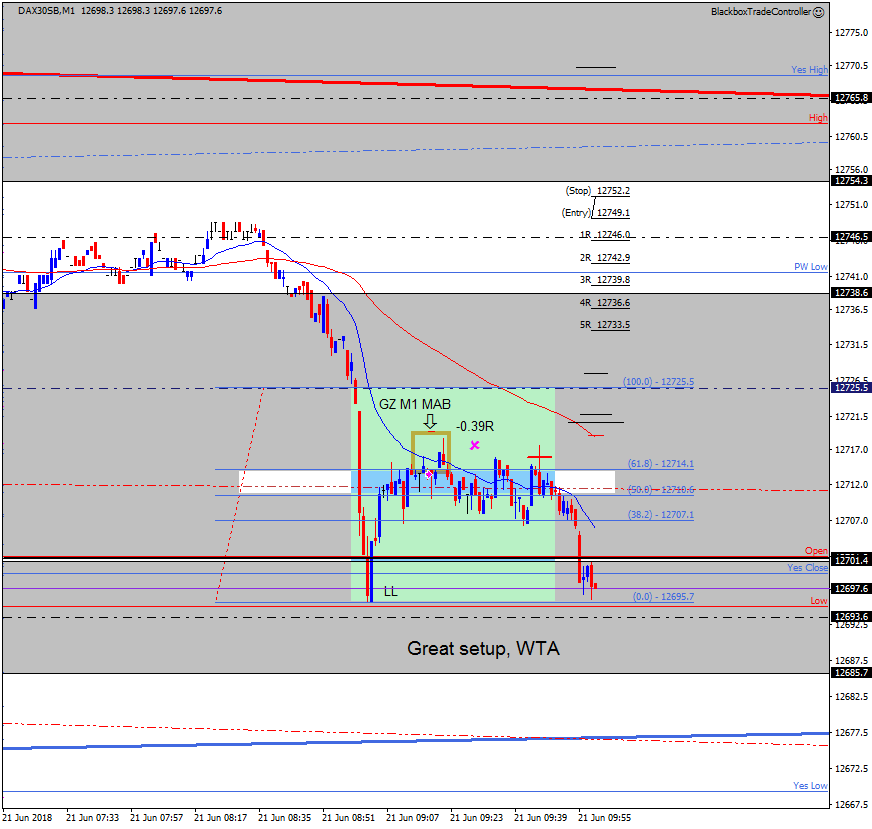
09:25
I took the M1 MAB at 07:18. The 2R was on the Open and eventually came in. I should have left it alone but moved my stop to reduce risk.
WTA though the chart comment should “Good setup” and not ‘Great’.
10:17
No M5 MAB so far though the following FIBCON turned out to be the sell setup.
I was very close to taking it but talked myself out of it.
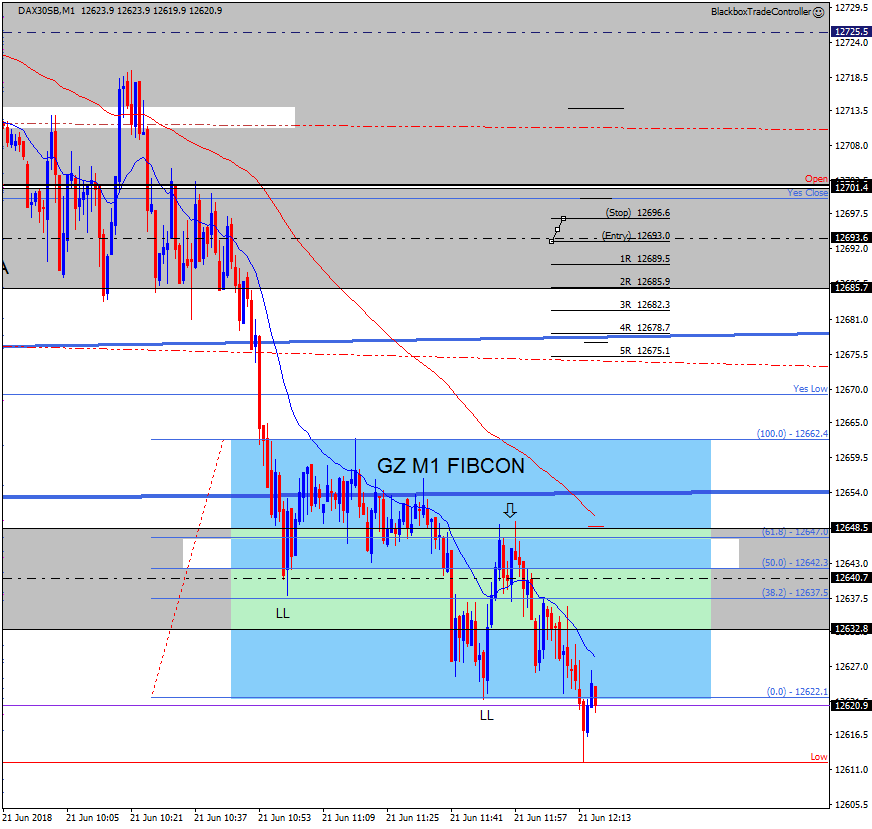
10:30
Price has sold off down to the bottom of the daily key zone at 12577.5, the daily chart shows this clearly, will it bounce back up into the zone or carry on down?
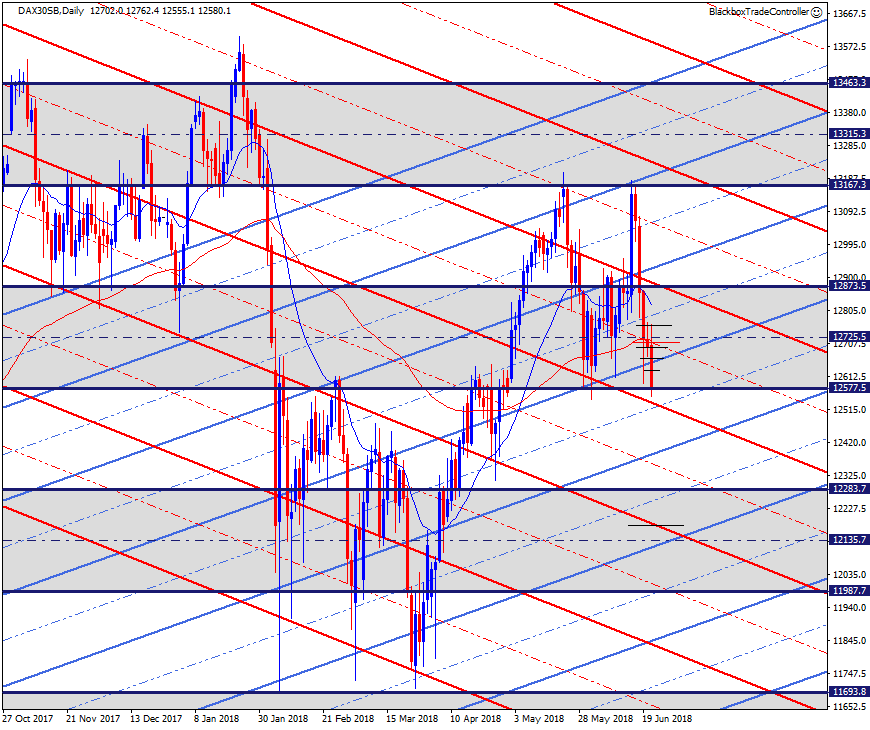
10:58
No M5 MAB so far though Golden Zone FIBCON sell setups are there as shown below.
I did consider the sell at 12595.6 but talked myself out of it 🙁 due to the zone of SUPCON I was selling into. I reasoned that it might move up to meet the M5 MA where another Golden Zone could be drawn.
The earlier LL turned out to be point A at 12622.5 and on this occasion and it makes sense structurally, however, I was focussed on the M5 MAB at the time and didn’t mark this up until after point C was clear.
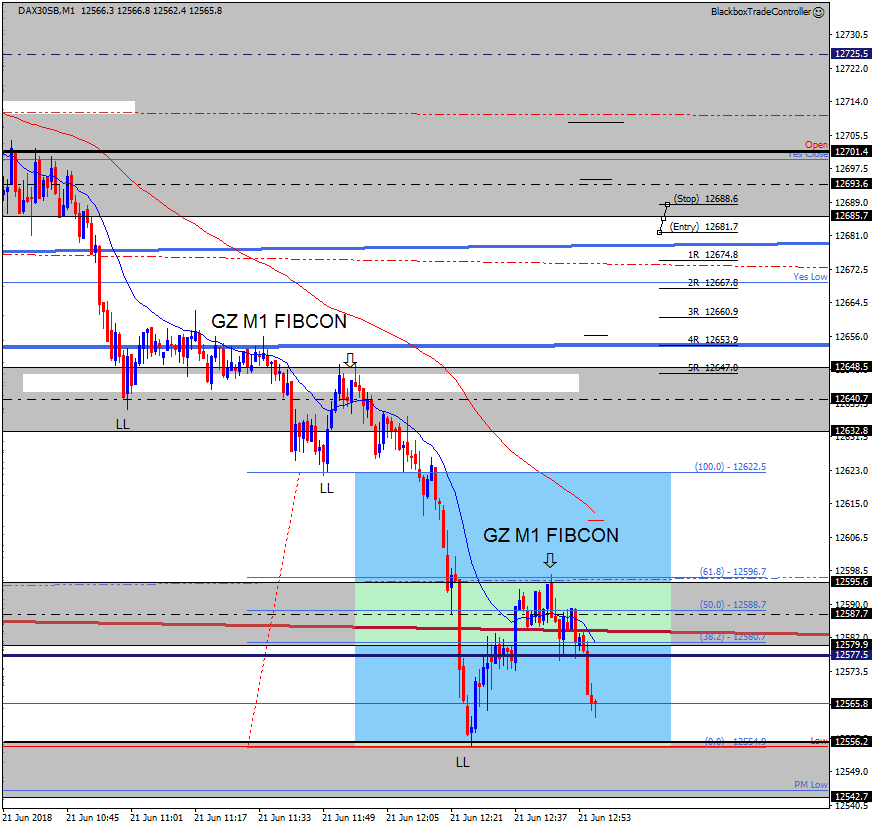
11:30
Still interested in the M5 MAB that may happen soon.
11:56
Took the M5 MAB but the bulls have stepped in so instant loser!
I stayed out earlier due to the zone of SUPCON price is in but talked myself into the first M5 MAB of the session. I moved my stop to protect it but not a good call this time.
Whilst waiting for the M5 MAB I talked myself out of two sell setups. I Would Not Take Again due to the context and area of SUPCON I was selling into.
As mentioned earlier, there was a high probability price would bounce (at least temporarily) back up ino the daily key zone off the 12577.5 level.
12:17
The more I look at the trade the more I see why I wouldn’t take it again due to context. I’ll also blame some of it on not having traded for the last few weeks and not feeling tuned into Price Action rhythmns 🙂
The M5 MAB was quickly followed by the M15 MAB which would have been a winner!
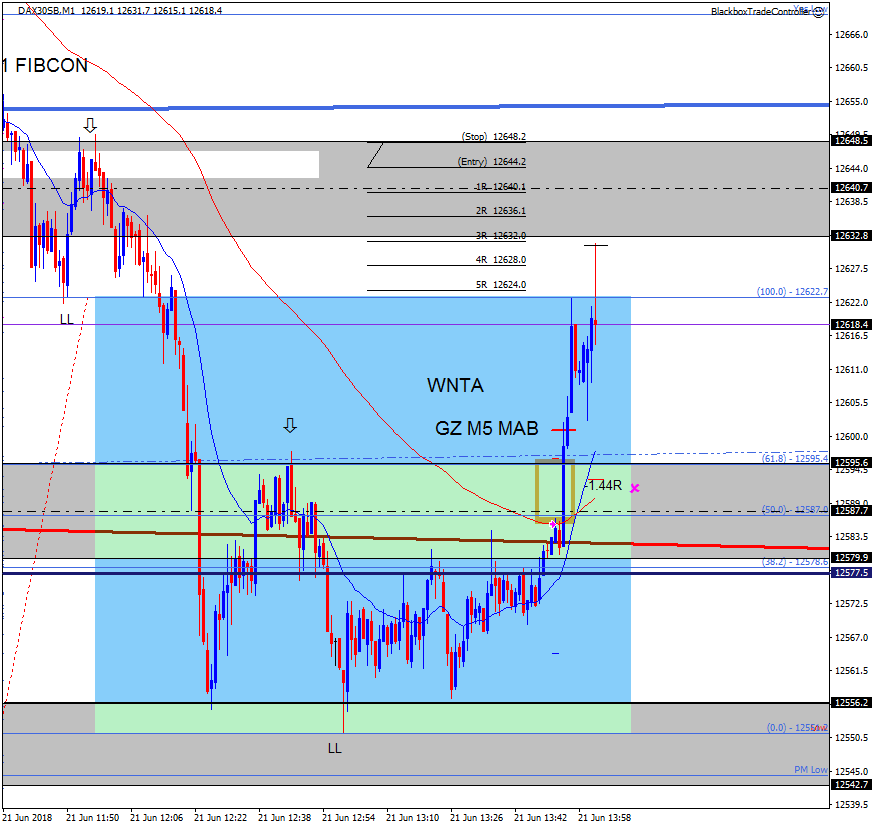
15:21
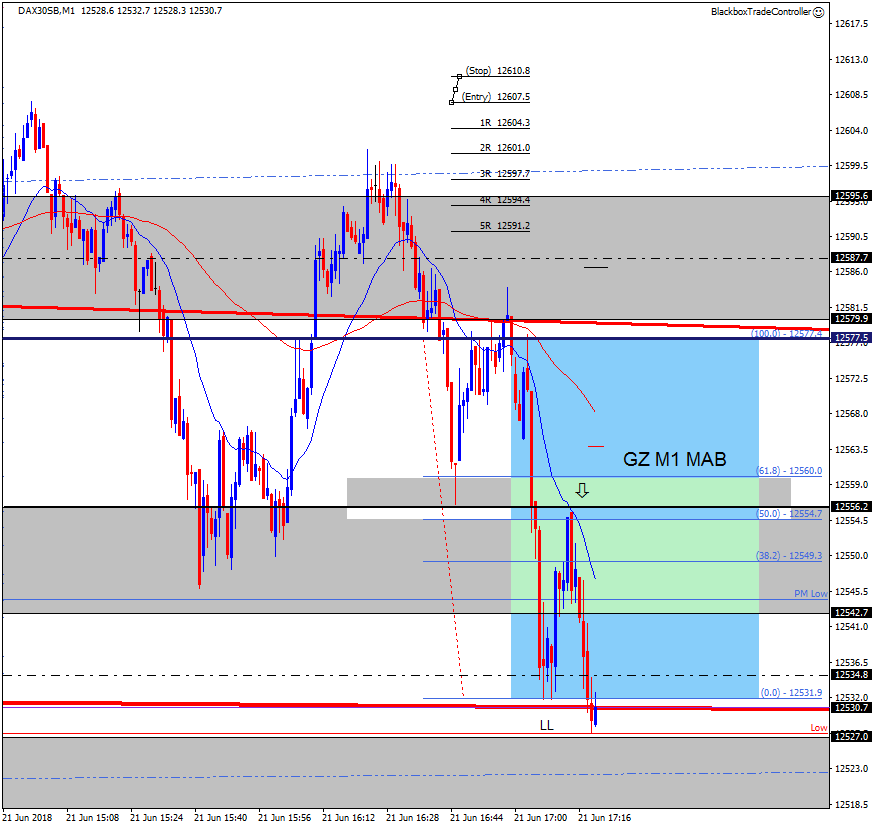
Been outside cleaning bikes ready for the weekend and just came in to see this superb M1 MAB. Point C was perfectly confluent with the 12556.2 key zone boundary plus the MA and the LL made 29 mins earlier is now role-reversal mode.
Price has now broke below the PM Low so as Alex mentioned, expect further weakness. It is currently testing a mid-bull/bear daily channel intersection.
Fri 22nd June 2018
08:28
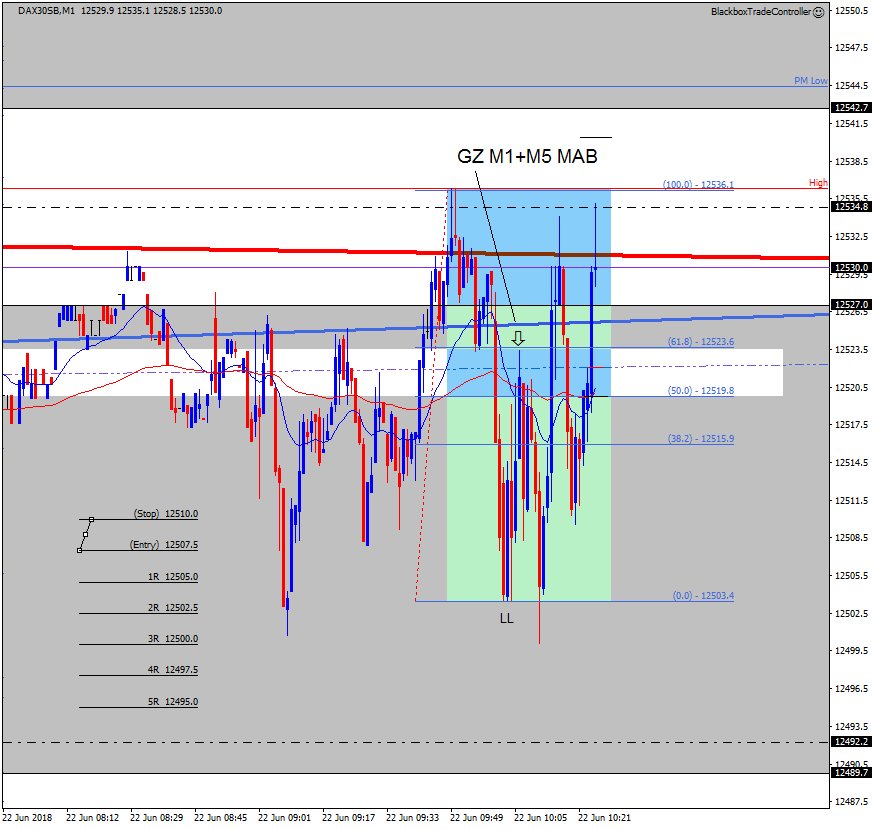
I did not trade this but whilst in a short-term range a decent sell MAB formed not long after the London open. Trading these requires total focus and timing but the FIBCON structure is there.
This is a test bookmark link
08:35
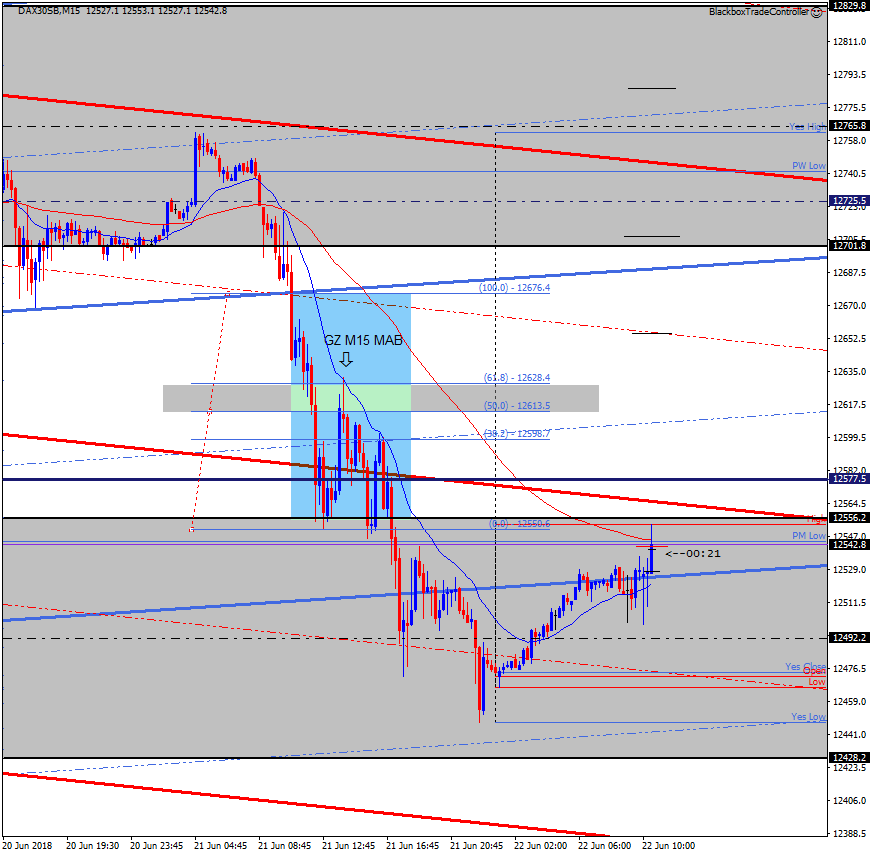
Also, remember yesterday the M5 MAB loser I had after waiting all morning. Take a look at what the bull spike formed on the 15 min chart.
A perfect GZ M15 MAB.
Had I marked that up then maybe I would have passed on the M5 MAB. When point A is at the hourly bull/bear intersection the 61.8 level is perfect.

Hi Phill,
Welcome back!
Good trade…