25th October 2017: Golden Zone MAB
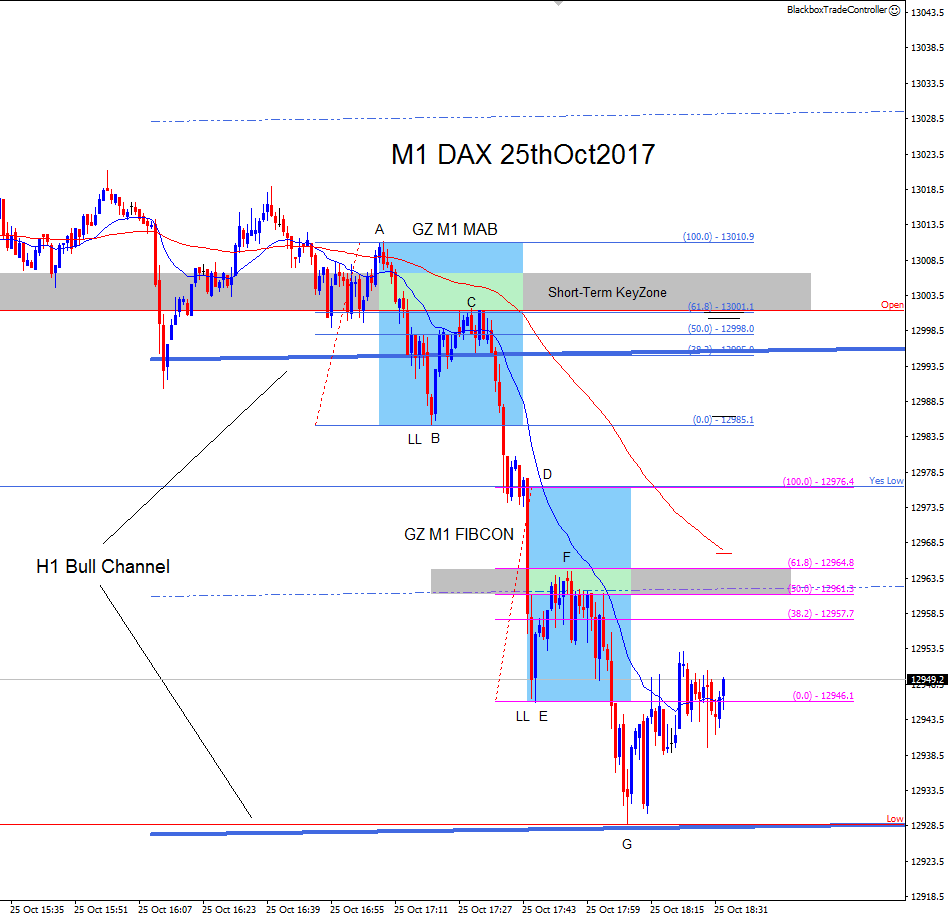
In this example of a Golden Zone MAB sell setup, trade entry at point C is perfectly confluent with the Open intraday key level, the 61.8 FIB level and the lower boundary of the short-term key zone which had previously acted as support at the BRN of 13000.
The 100% Fibonacci retracement level was taken from the start of the move at 13010.9 (point A).
Price broke below the Open and the lower boundary of the short-term key zone at 13000, into the H1 Bull Channel to make a lower-low at point B before retracing back to it at point C resulting in a Golden Zone M1 MAB sell trade.
A second trade opportunity followed as price continued to push lower into the H1 Bull Channel to make another lower-low at point E before retracing to point F resulting in a Golden Zone FIBCON sell trade.
Trade entry at point F is confluent with the H1 Bull Mid-Channel, the short-term key zone and the 61.8 FIB level at 12964.8.
In this case the 100% retracement level was taken from Yes Low intraday key level.
Price continued making its way down, eventually reaching the bottom of the H1 Bull Channel to set the session low at point G.
Once price broke below the 13000 level and back into the H1 Bull Channel, experienced price action traders may have anticipated the move down to the bottom of the H1 Bull Channel. That being the case, they could have entered the sell trade at point C and trailed their stop to achieve a multiple R trade.
9th October 2017: Golden Zone MAB
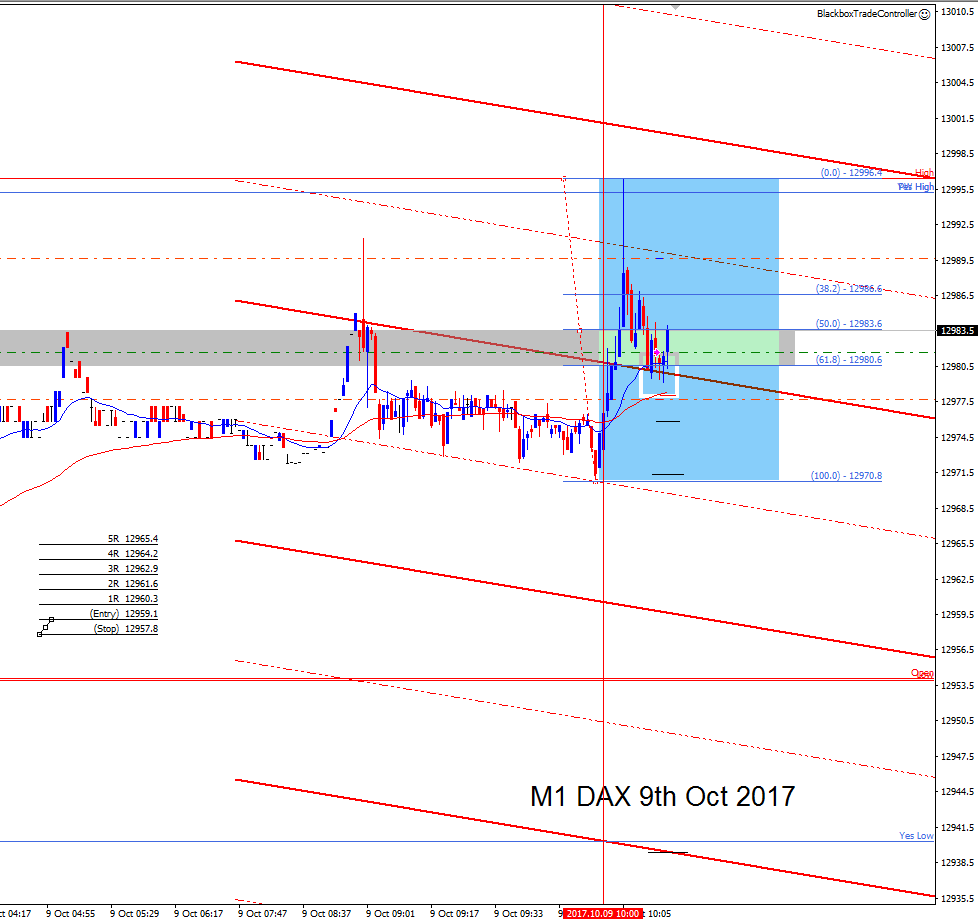
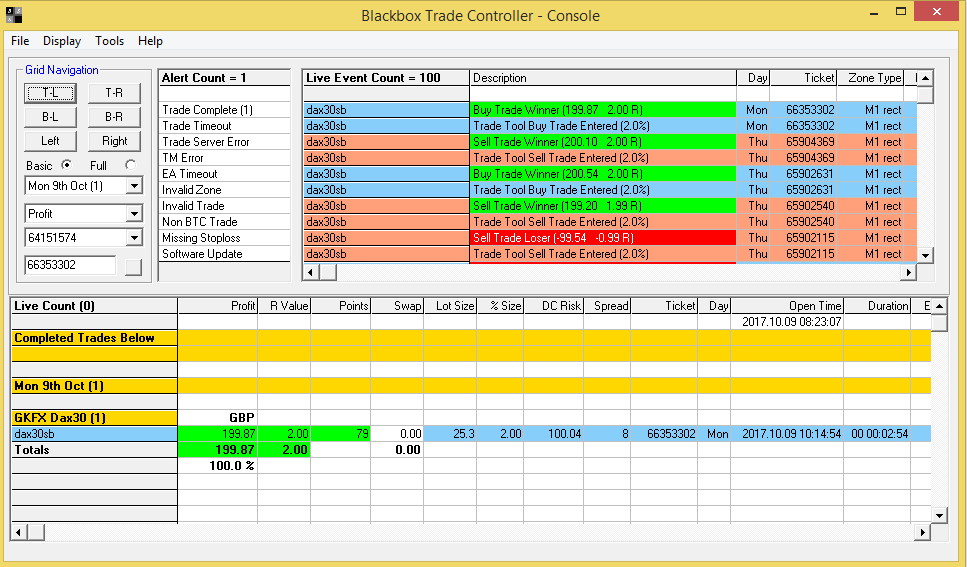
This example shows a Golden Zone MAB buy trade taken using the Trade Tool.
The trade parameters have been automatically marked on the chart by the Blackbox Trade Controller software. The rectangular zone represents the exact trade entry specifics for this buy trade where; the upper boundary is the trade entry level at 12981.7 and the lower boundary is the stop loss level at 12977.7. The 2R profit target is just below the M5 mid-channel line at 12989.6.
The screenshot below shows what happened afterwards over the next few hours.
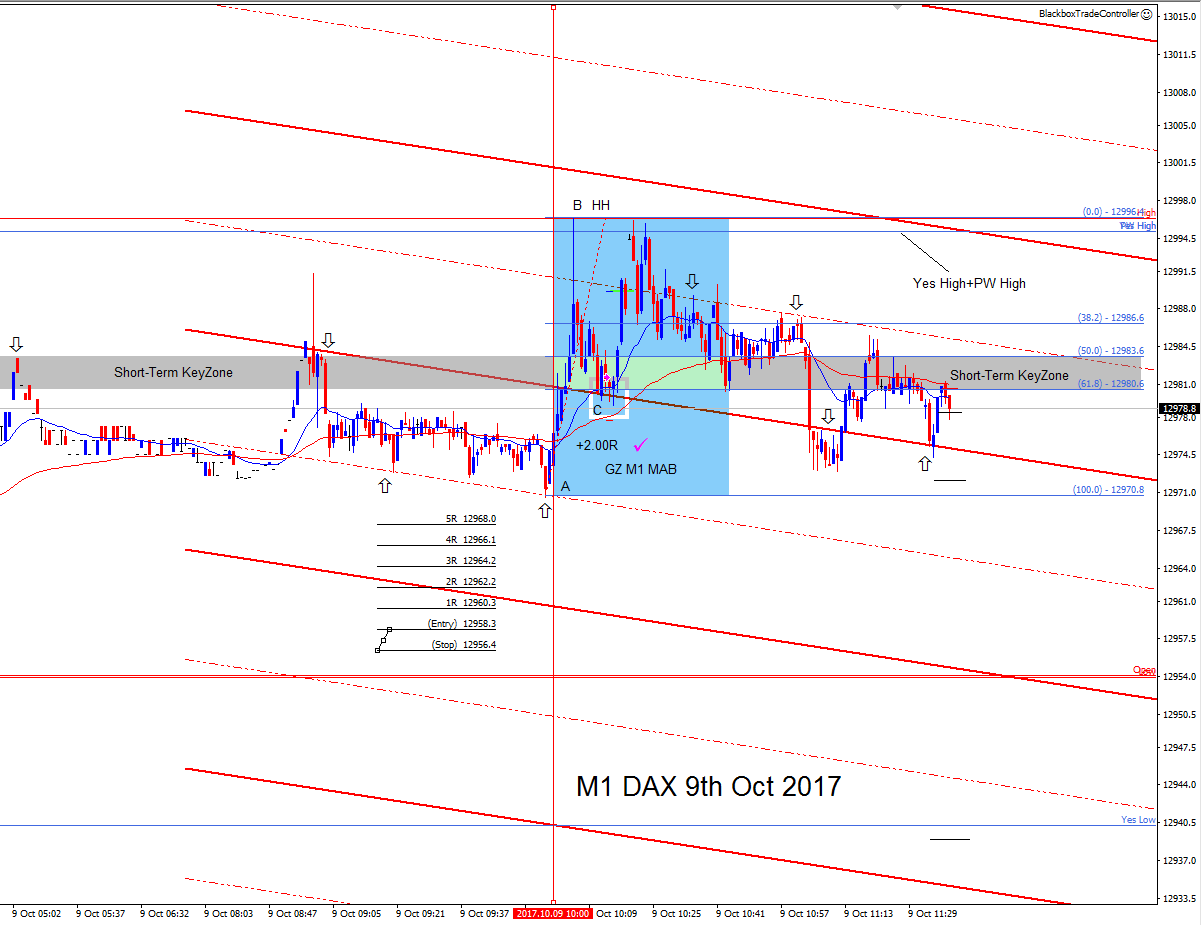
In this example of a Golden Zone MAB buy setup, trade entry at point C is confluent with the M1 21 period EMA, the M5 Bear Channel, the 61.8 FIB level at 12239.7 and the short-term key zone which had previously acted as resistance.
The red vertical line represents the London open at 8am GMT (10:00am broker time), after which price moved up strongly before running into resistance at Yes High and the PW High intraday key levels.
The 100% FIB retracement level was taken from the M5 Bear Mid-Channel (point A) which also happens to be the start of the move at 12970.8.
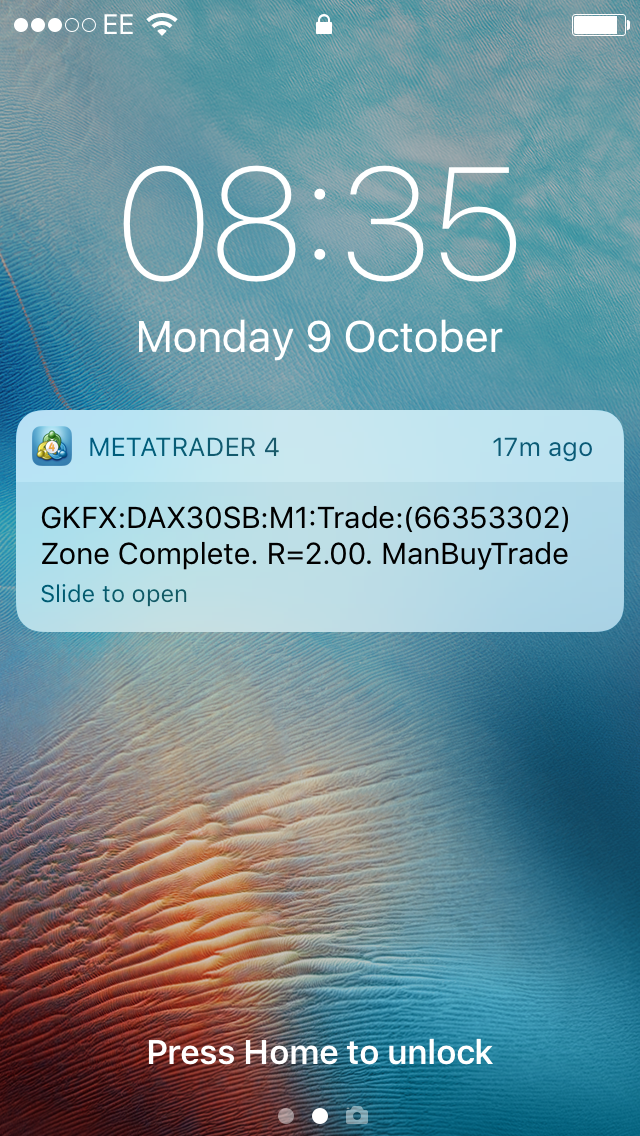
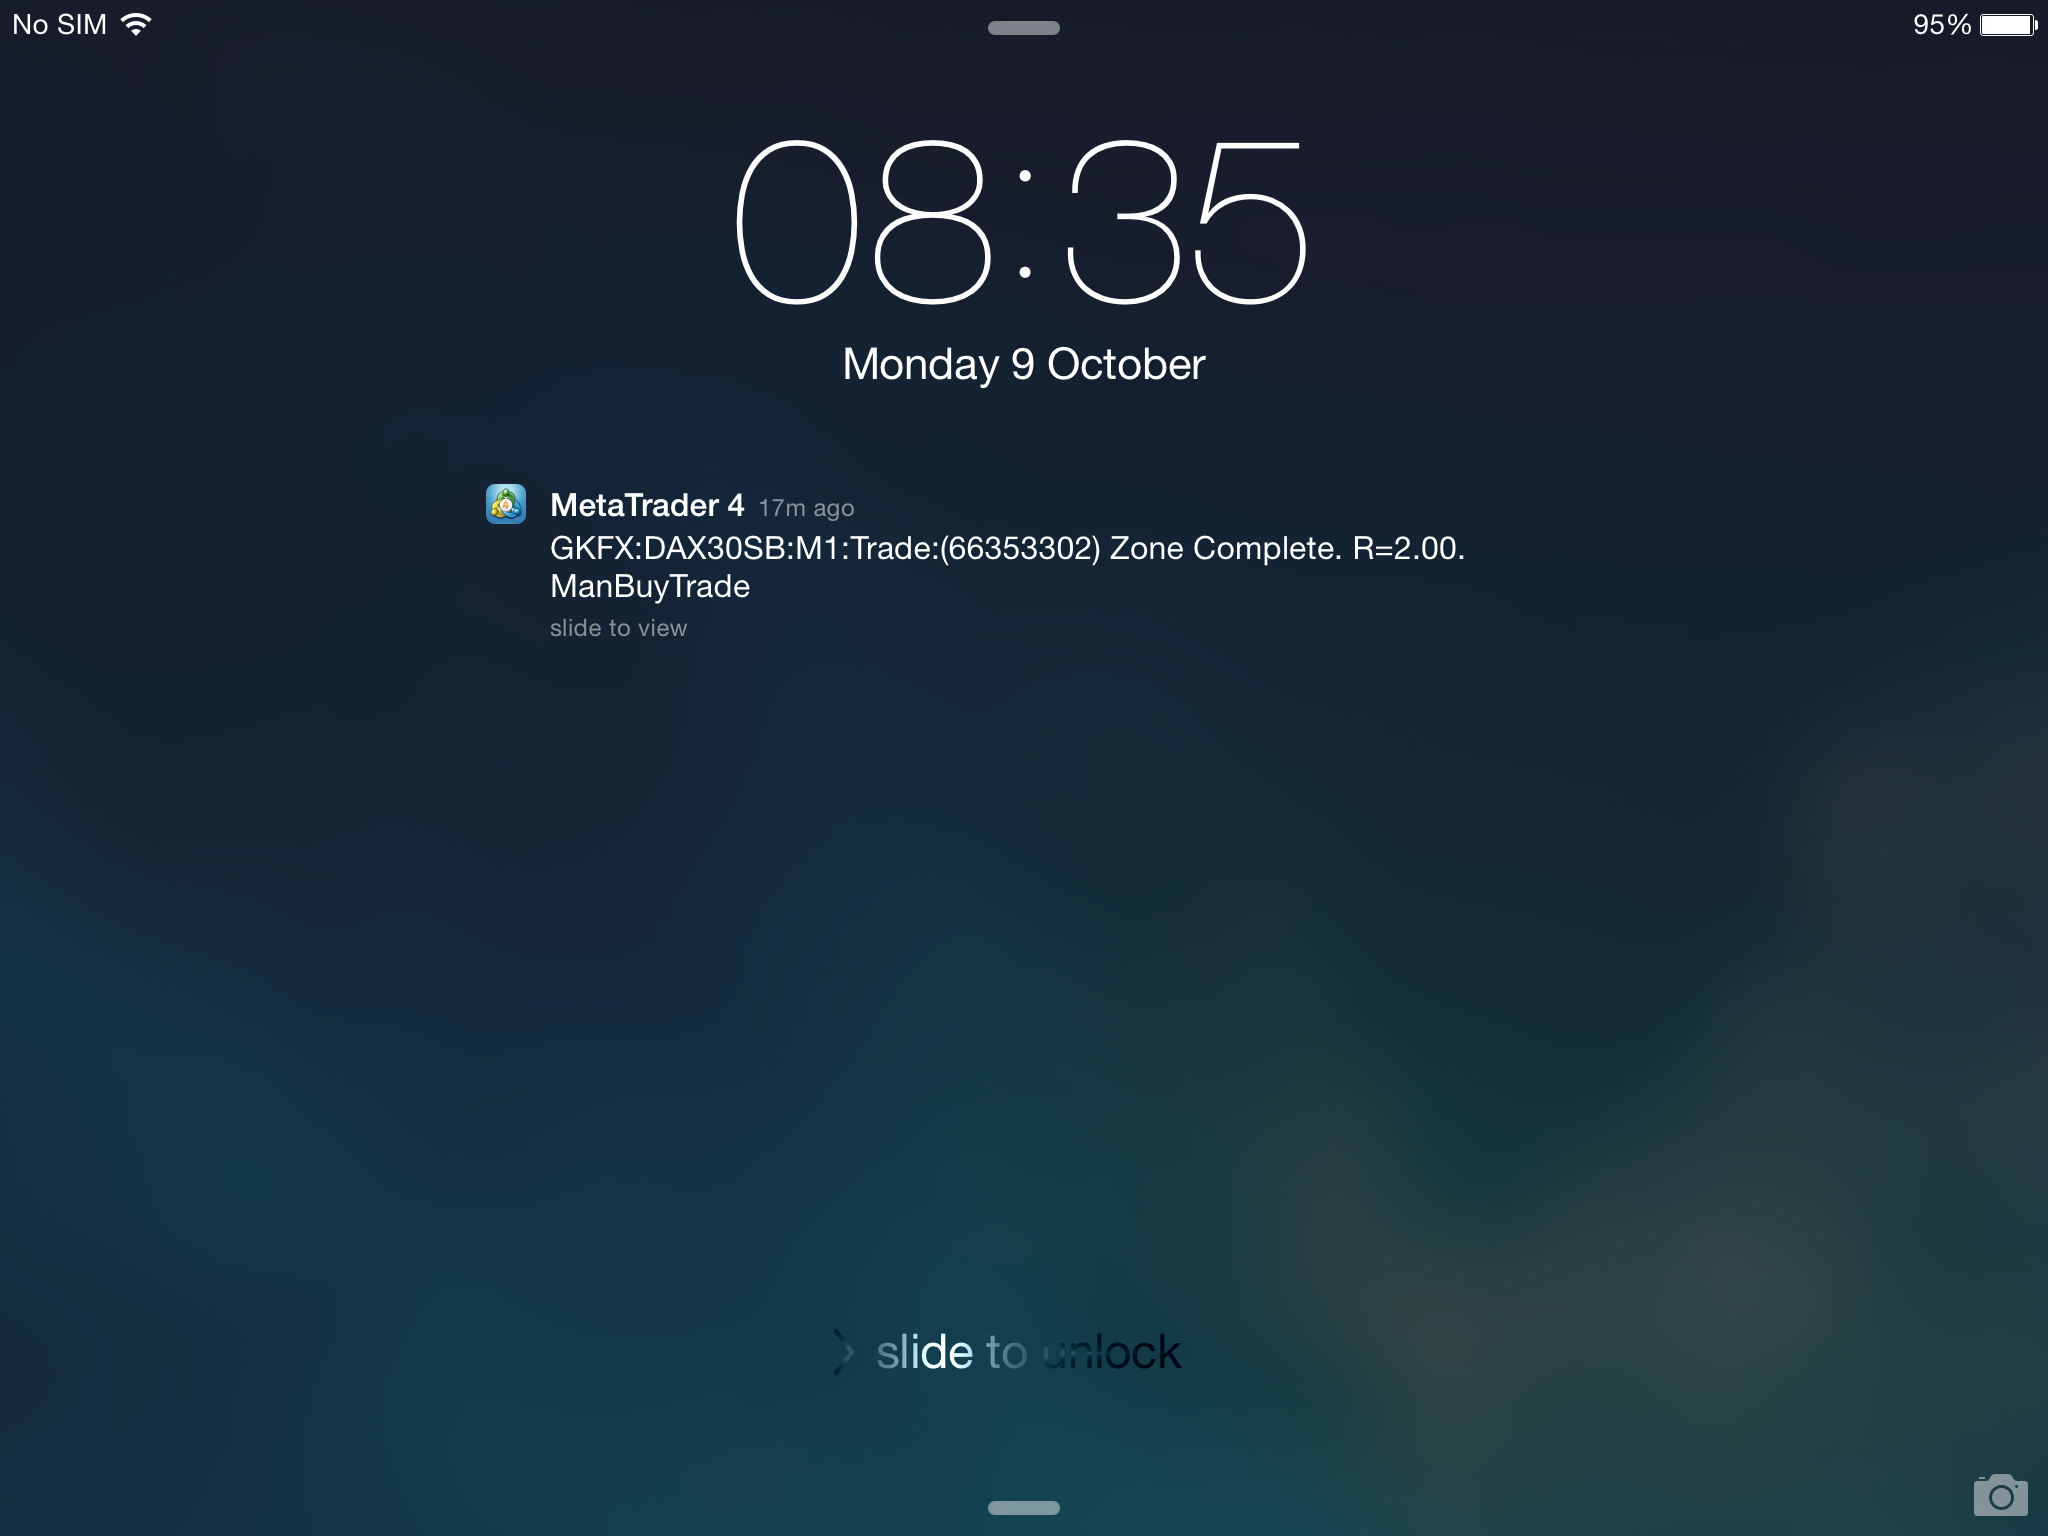
The trade duration was 2:54 minutes and resulted in the 2R winner that you can see marked on the chart by the Trade Controller. After reaching the target just below the M5 Mid-Channel, price briefly pulled back before gapping up to re-test the session high at point B .
After failing to break through the the intraday key levels just below point B for a second time, price reversed and dropped back into the M5 Channel as marked by the arrows.
The next screenshot shows what happened later in the morning session.
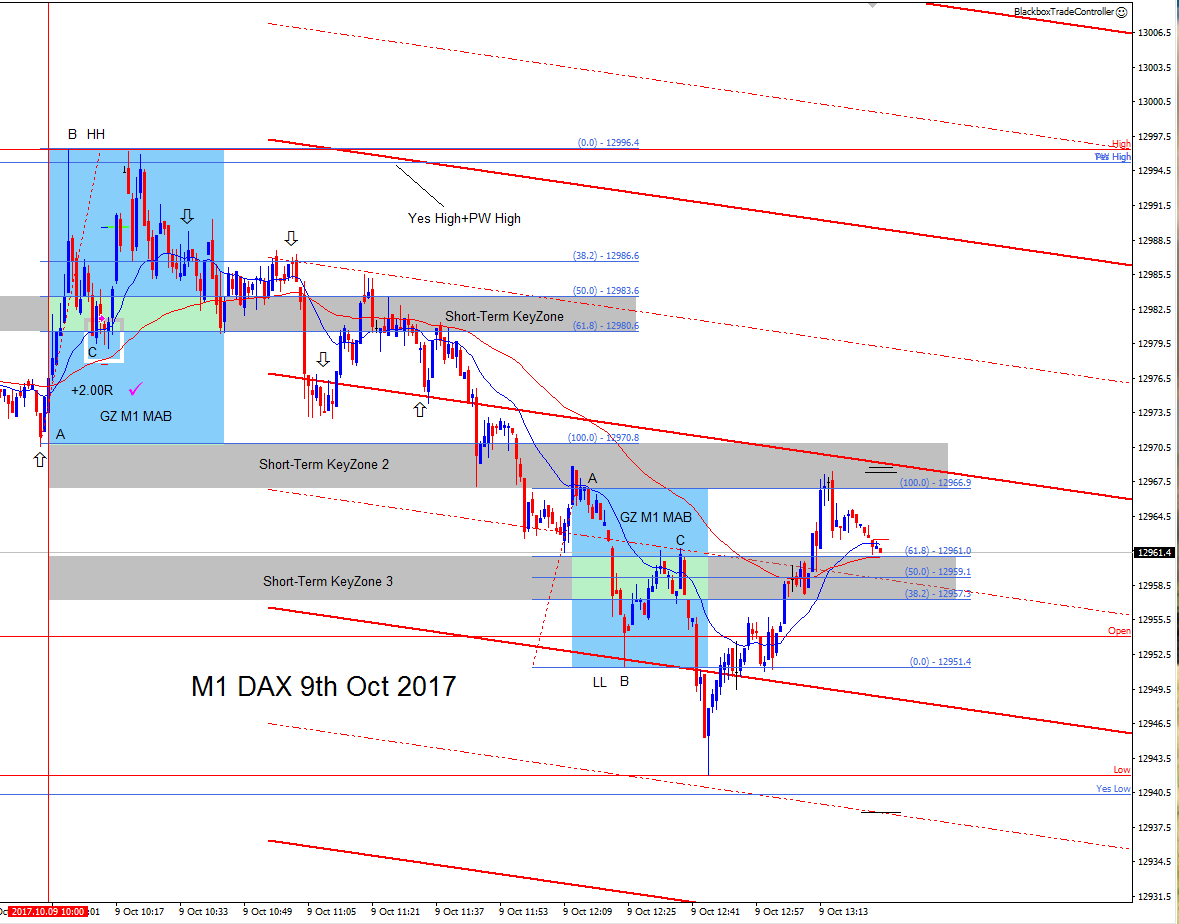
After failing to break through the session high at 12996.4, price continued to sell-off resulting in a Golden Zone M1 MAB sell trade opportunity.
Trade entry at point C is confluent with the M5 Bear Mid-Channel, the 61.8 FIB level at 12961.0 and the upper boundary of short-term key zone 3 which had previously acted as support.
Notice how well the M5 Bear Channels captured price as it sold off.
The 100% FIB retracement level was taken from the lower boundary of short-term key zone 2 which had previously acted as support.
Notice how the height of short-term key zone 3, which is precisely between the 38.2 and 61.8 levels, is exactly the same height as the short-term key zone 2.
This is another example of the rhythm and symmetry built into price action. The challenge is learning how to identify this rhythmic movement and ultimately profit from it!
The screenshots in the carousel below document the complete sequence of events described above and show the trade results that were recorded in the Trade Console and sent to mobile devices.


4th October 2017: Golden Zone MABs
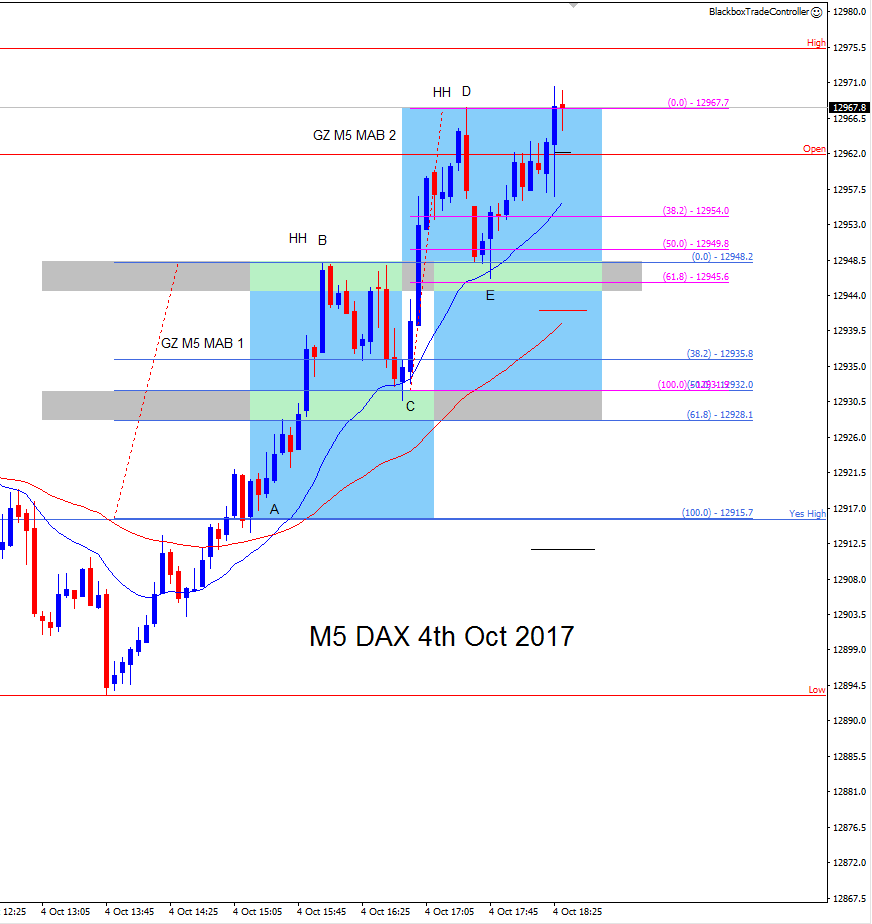
This example shows two Golden Zone M5 MAB buy setups.
The price action in this screenshot for the 5 minute time frame is almost identical to that in the screenshot above for the hourly time frame which occurred on the same day. This demonstrates the fractal nature of Pure Price Action chart patterns.
2nd-4th October 2017: Golden Zone MABs
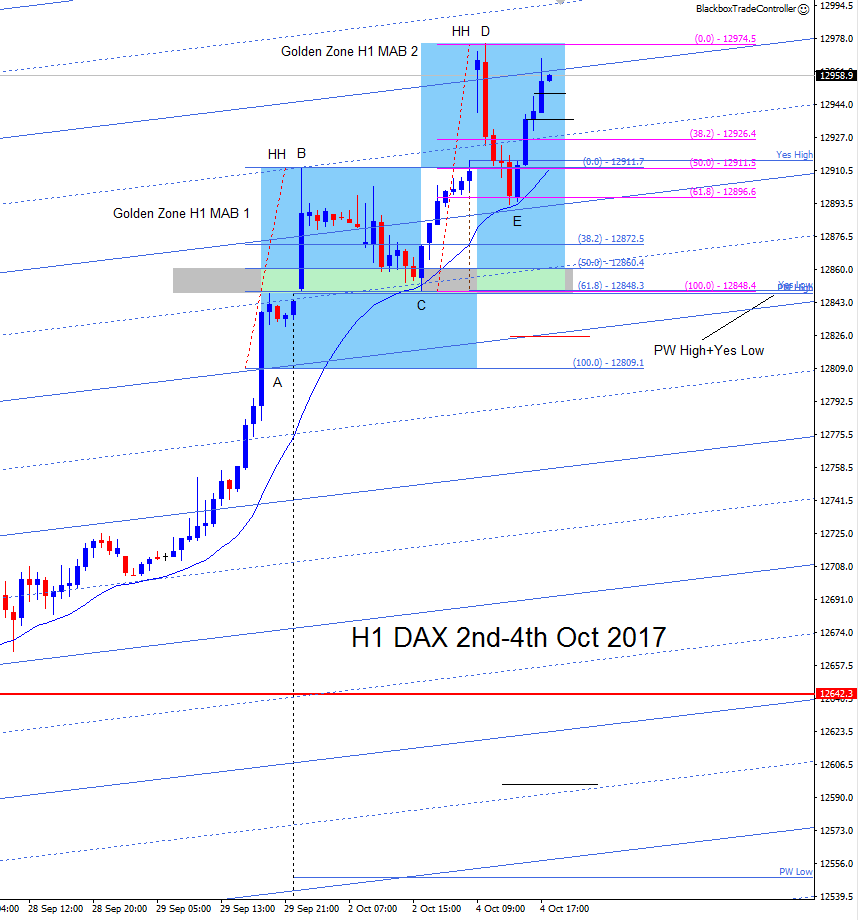
This example shows two Golden Zone H1 MAB buy setups.
In the first example, trade entry at point C is perfectly confluent with the H1 21 period EMA, the PW High and Yes Low intraday key levels, the H1 Bull Mid-Channel and the 61.8 FIB level.
The 100% Fibonacci retracement level was taken from point A at 12809.1 which was perfectly confluent with the H1 Bull Channel.
Price broke right through the H1 Bull Channel moving strongly up to the H1 Bull Mid-Channel above, making a higher-high at point B.
Price retraced to point C and met resistance in the form of the H1 21 period EMA, the two intraday key levels, the H1 Bull Mid-Channel below and the 61.8 FIB level, resulting in a high energy H1 MAB buy trade opportunity.
In the second example, trade entry at point E is perfectly confluent with the H1 21 period EMA, the H1 Bull Channel and the 61.8 FIB level.
In this case, the 100% Fibonacci retracement level was taken from point C at 12848.3 which was perfectly confluent with the PW High and Yes Low intraday key levels and the H1 Bull Mid-Channel.
Price made another higher-high at Point D before retracing to point E, just above the H1 Bull Channel, and met resistance in the form of the H1 21 period EMA and the 61.8 FIB level, resulting in another high energy H1 MAB buy trade opportunity.
Notice how well price is captured by the H1 Bull Channels of the Price Action Grid.
Specialization can prove to be very conducive. Traders can use the Price Action Grid and the Blackbox Custom Setup to focus their efforts on a single market and consider the higher time frame context whilst looking to precisely time trade entry on the lower time frames.
11th September 2017: Golden Zone MAB
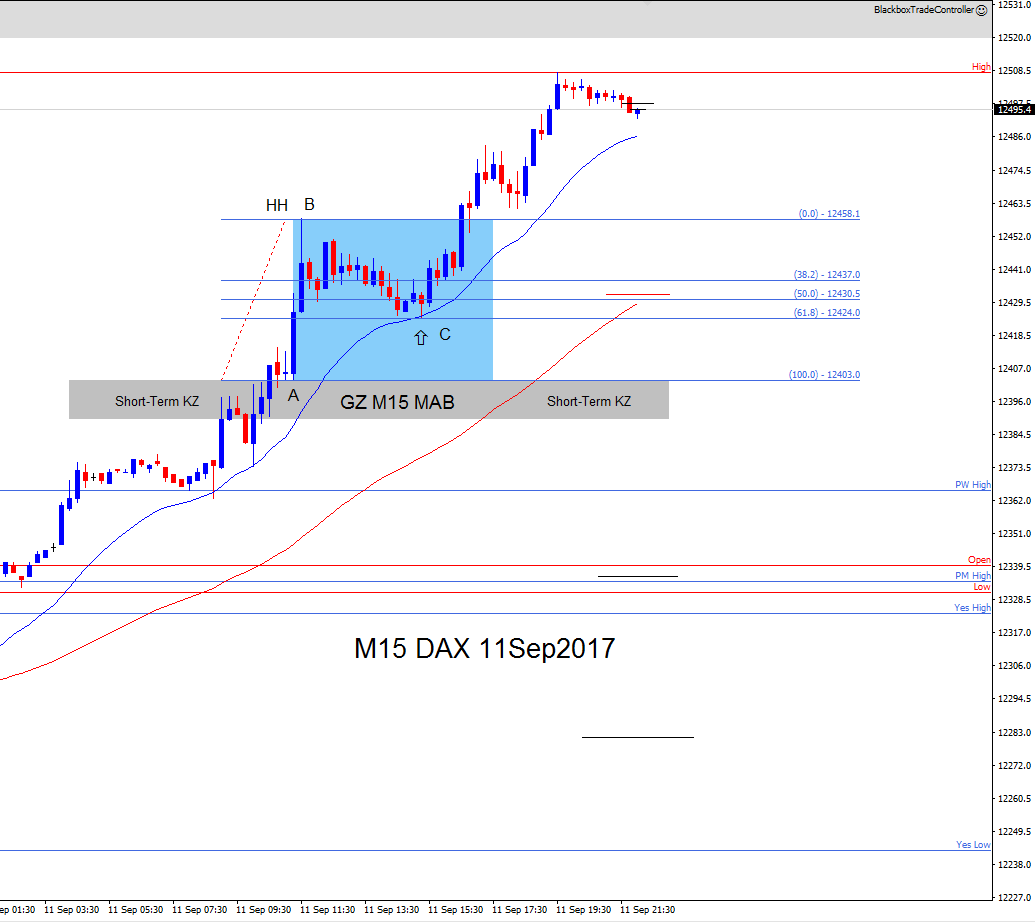
In this example of a Golden Zone MAB buy setup, trade entry at point C is perfectly confluent with the M15 21 period EMA and the 61.8 FIB level at 12424.0.
The 100% Fibonacci retracement level was taken from the upper boundary of the short-term key zone (point A) which has previously acted as resistance before price broke through it and made a new high at point B.
Price retraced to point C and met resistance in the form of the M15 21 period EMA and the 61.8 FIB level, resulting in the buy trade opportunity.
This is another great example of Fibonacci symmetry forming the building blocks of chart structure.
25th August 2017: Golden Zone MAB
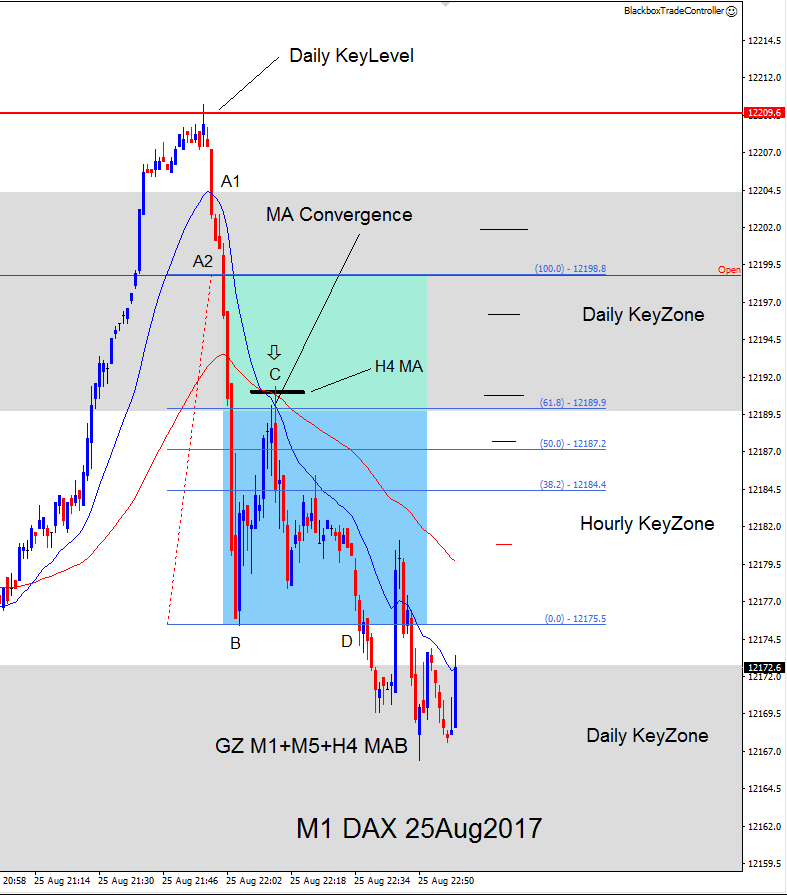
In this example of a Golden Zone MAB sell setup, trade entry at point C is confluent the M1, M5 and H4 21 period EMAs, the lower boundary of the Daily Key Zone and the 61.8 FIB level at 12189.9.
The 100% Fibonacci retracement level was taken from the Open intraday key level (point A2).
This screenshot shows two points, A1 and A2 where the 100% FIB retracement level could potentially have been taken from, A1 is at the upper boundary of the Daily Key Zone and A2 is at the Open.
In this case, the Open (point A2) was chosen because when taken from here the 61.8 FIB level was not only perfectly confluent with the lower boundary of the Daily Key Zone but also with the M1, M5 and H4 21 period EMAs, forming a convergence at point C and a ‘Golden Zone’ setup.
Therefore since we deal in probabilities the 100% Fibonacci retracement from the Open presented the strongest case and was the most likely.
Identifying and marking up Fibonacci retracement levels is a skill that comes with practice and experience, as described in the section Fibonacci Setups.
24th August 2017: Golden Zone FIBCON
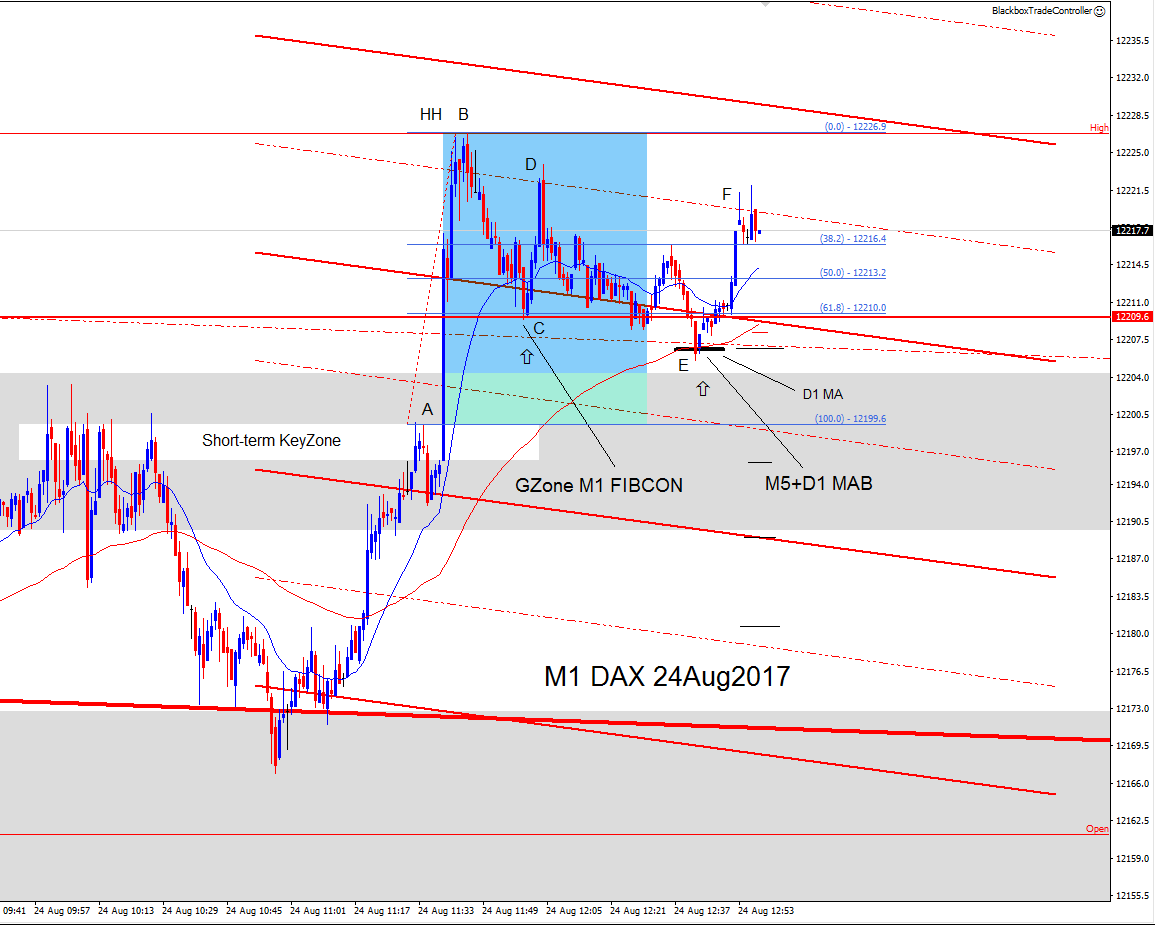
In this example of a Golden Zone FIBCON buy setup, trade entry at point C is perfectly confluent with the higher time frame key level at 12209.6 and the 61.8 FIB level.
The 100% Fibonacci retracement level was taken from the upper boundary of the short-term key zone (point A) which has previously acted as resistance before price broke through it and made a new high at point B.
Price moved up to the M5 Bear Mid-Channel before retracing through the lower boundary of the M5 Bear Channel, it met resistance in the form of the M5 21 period EMA which had converged with the Daily 21 period EMA (shown by the thick black line), resulting in another trade opportunity at point E.
This M5+D1 ‘Moving Average Convergence’ at point E was perfectly confluent with the H1 Bear Mid-Channel.
17th August 2017: Golden Zone MAB
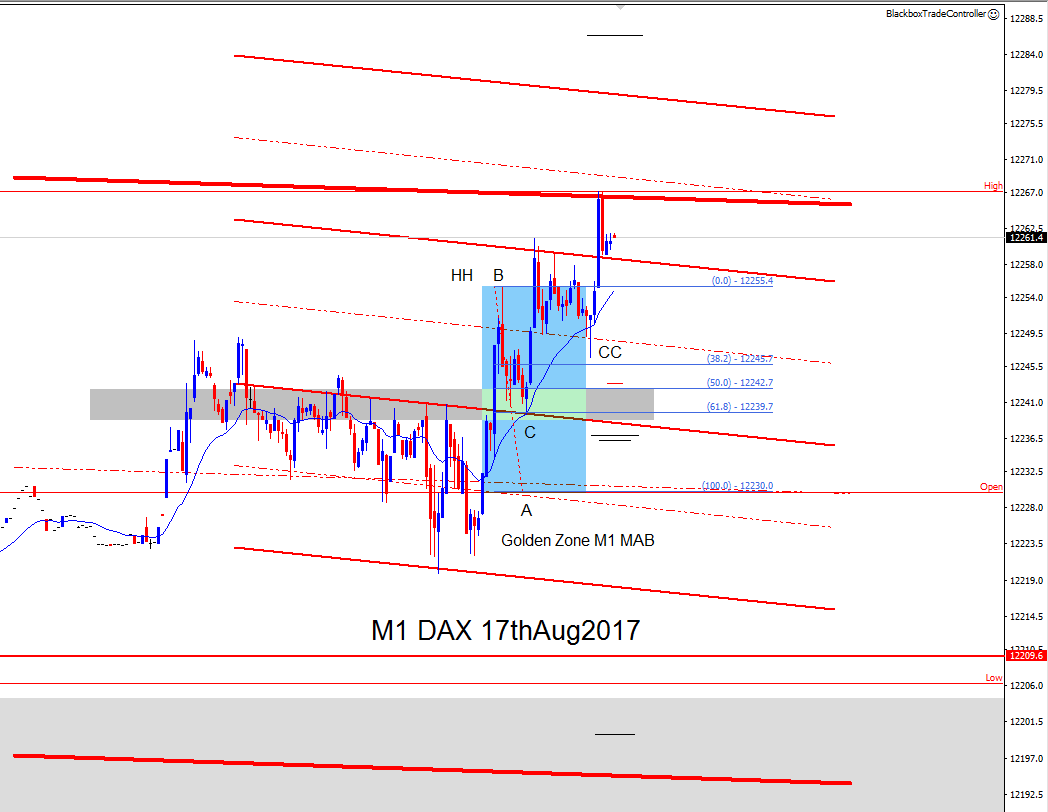
In this example of a Golden Zone MAB buy setup, trade entry at point C is perfectly confluent with the M1 21 period EMA, the M5 Bear Channel, the 61.8 FIB level at 12239.7 and the short-term key zone which had previously acted as resistance.
The 100% Fibonacci retracement level was taken from the Open intraday key level (point A) which is confluent with the intersection of the M5 and H1 Bear Mid-Channels.
A second M1 MAB followed, with trade entry at point CC where there happens to be two pin-bar type candles. However as mentioned previously, they are irrelevant since it is structure that determines trade entry.
Notice how well price is captured by the M5 and H1 Bear Channels of the Price Action Grid.