5th June 2020
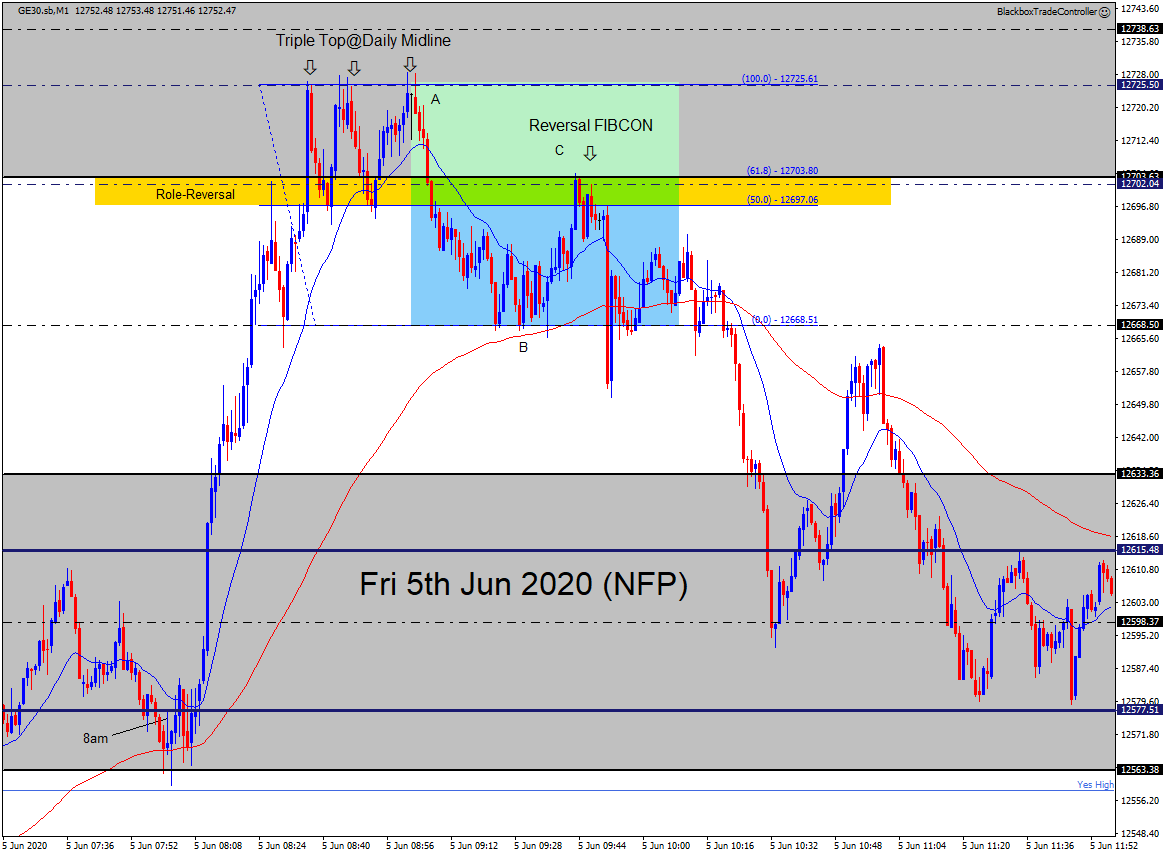
This Reversal FIBCON Sell setup occurred on Friday 5th June 2020 (NFP).
Price moved up strongly after 8am then ran into major resistance at the D1 EQZ Midline at 12725 and produced a Triple-Top before selling back off down to the midline at 12668 producing the impulsive A-B leg of the move. Price found support here and the M5 MAB kicked off the move back up to the H4 EQZ Midline at 12702 to form point C.
Point C was confluent with the following:
- H4 EQZ Midline@12702
- M30 EQZ level@12703
- 61.8 FIB level
- Great Role-Reversal, Look-Left!
This Reversal FIBCON resulted in an easy 2R winner.
The screenshot below shows another great Reversal FIBCON that occurred later in the session after the NFP announcement.
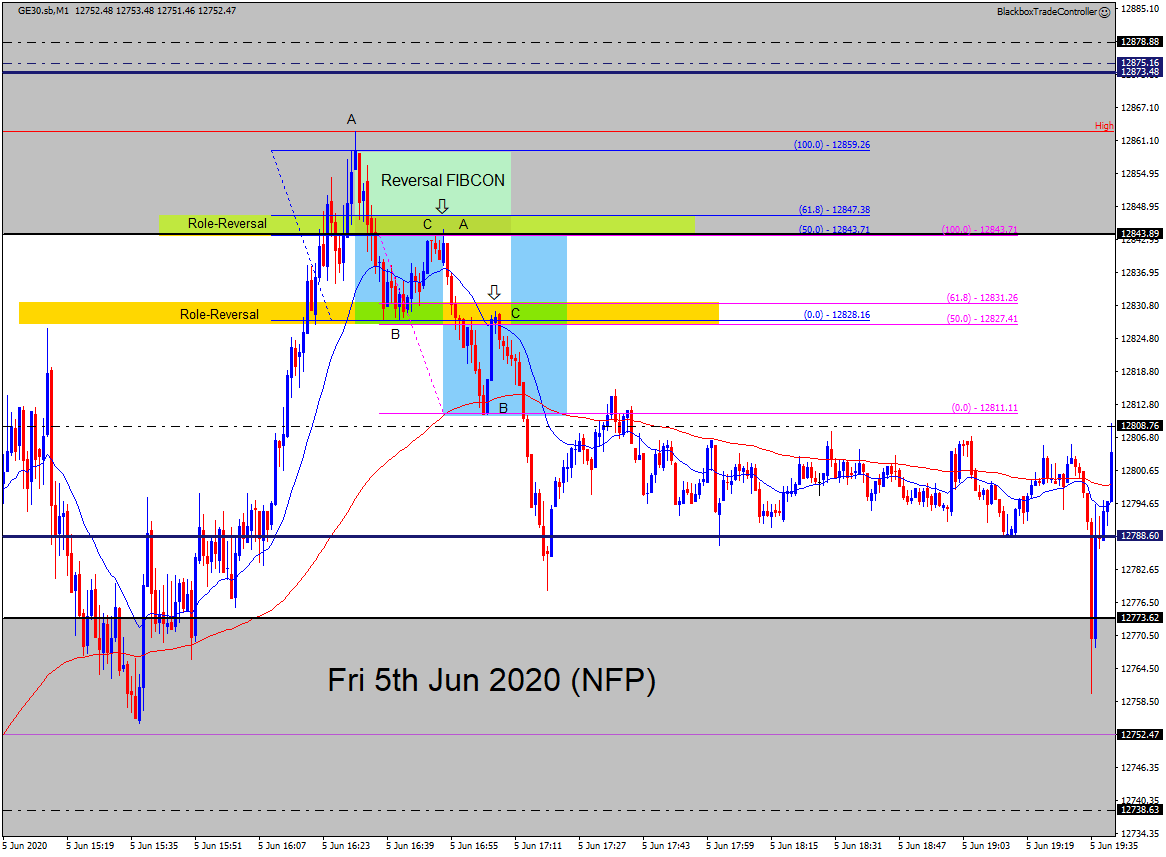
After the NFP announcement price moved on up to make a new high before producing another Reversal FIBCON Sell setup followed by an M1 Sell MAB as price continued to move back down through the zone.
25th May 2020
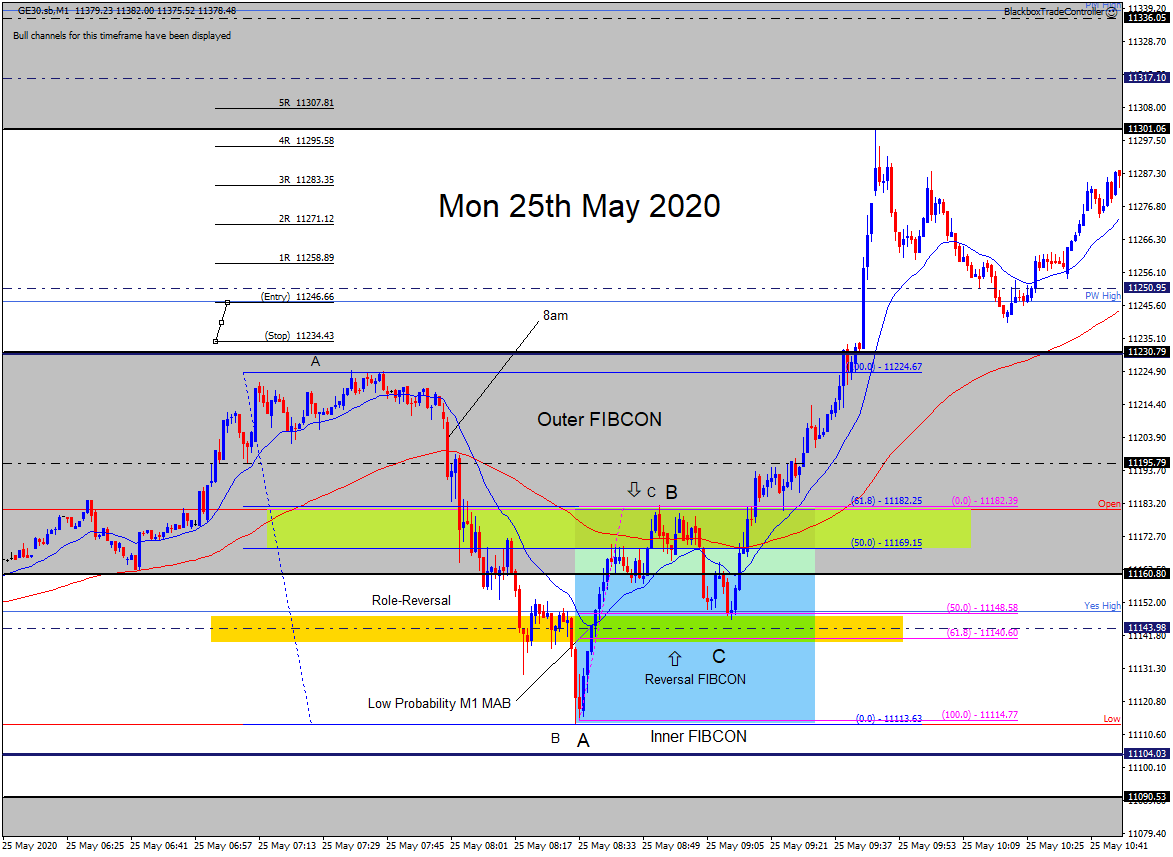
Here are two great examples of Reversal FIBCON setups that occurred on Monday 25th May 2020.
The first one formed at 9am as price found support at the lower D1 EQZ at 11104, point A. Price moved up from here through the M1 and M5 MAs before finding resistance at the Open, point B which was confluent with the 61.8 FIB retracement level from the move down.
Price reversed moving back down to Yes High which was confluent with the 50 FIB retracement level from the move up from the support at the D1 EQZ forming the Reversal FIBCON buy setup at point C, offering a multiple R trade opportunity.
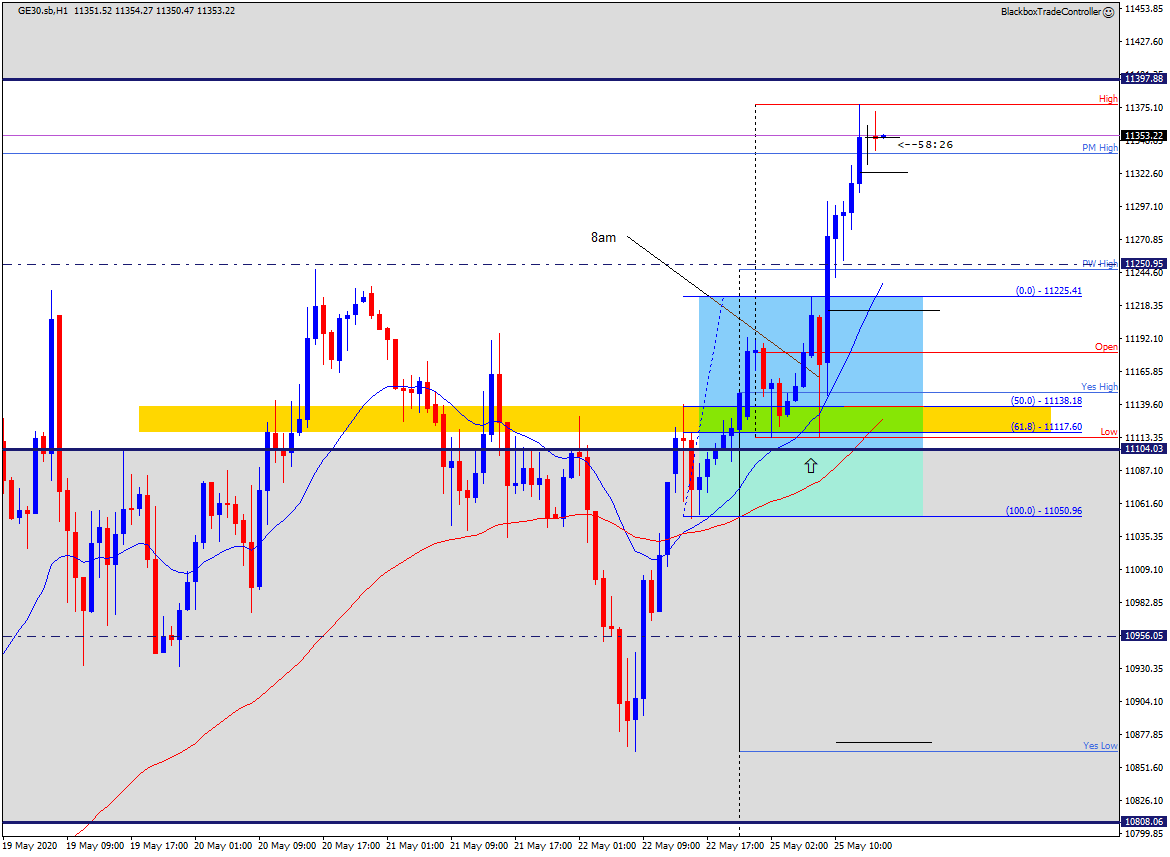
The screenshot below shows the higher timeframe context on the H1 chart where price had moved down strongly at 8am and found support at the D1 EQZ which was confluent with the Golden Zone before reversing and moving strongly back up.
The screenshot below shows the second Reversal FIBCON which formed after price continued on up and found resistance at the upper D1 EQZ at 11397 producing a Sell setup just before 5pm.
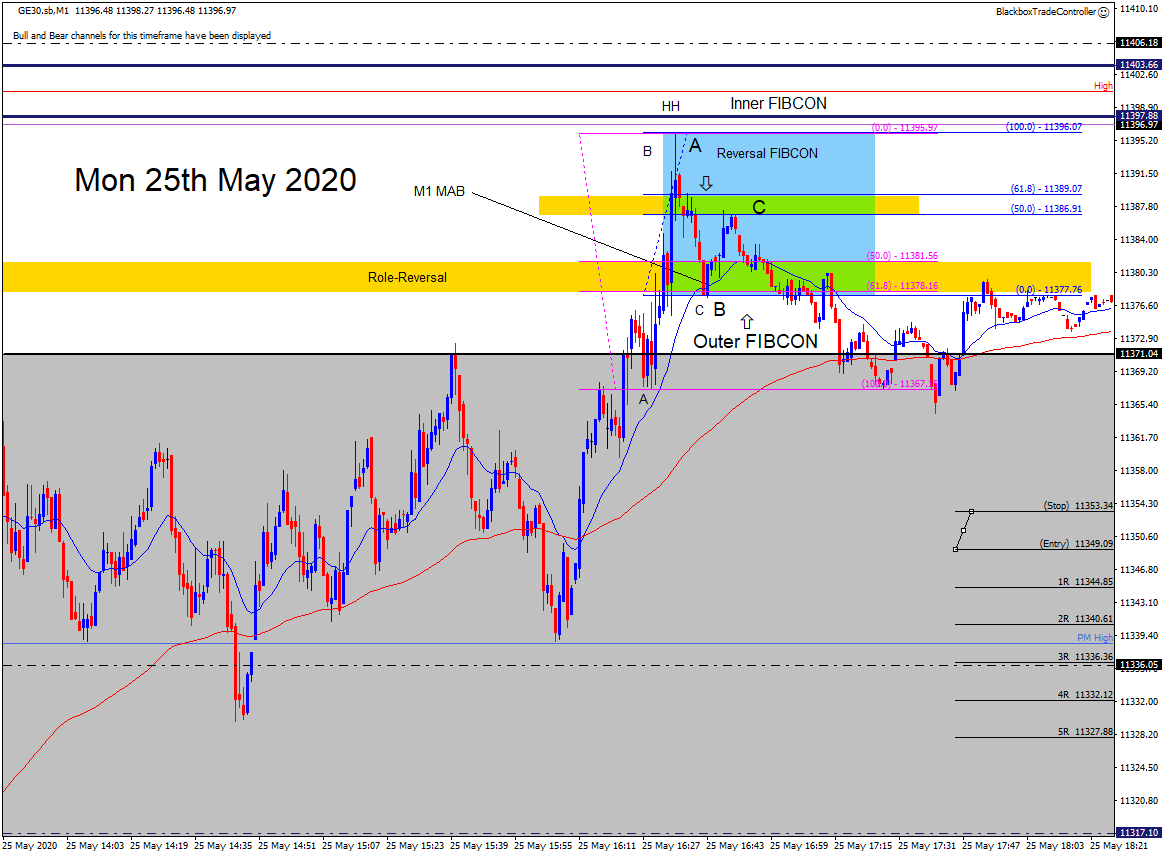
These examples demonstrate the benefits of specialization and the importance of mastering how to trade these high energy, high probability, high value chart patterns.
The following video provides a detailed commentary on the days price action and trade setups.
20th May 2020
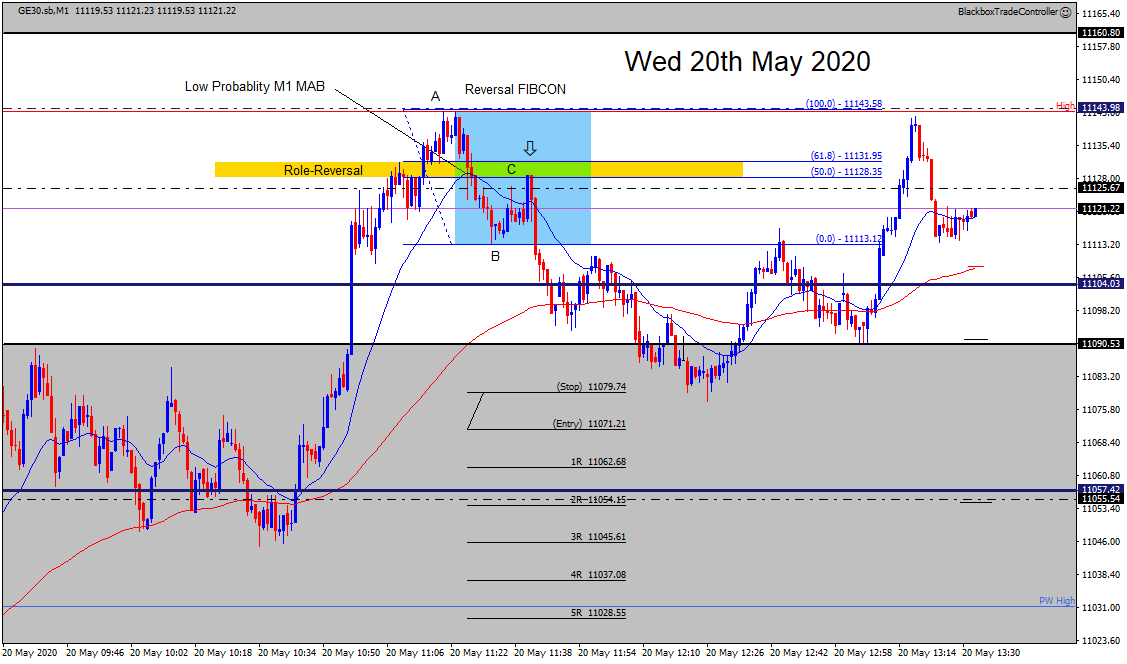
This example shows a Reversal FIBCON Sell setup that formed when price moved up and found resistance at the H4 Midline at 11143.
In real-time, you would have needed to be nibble and have the Trade Tool positioned at the 50 FIB retracement level otherwise you would have missed this one.
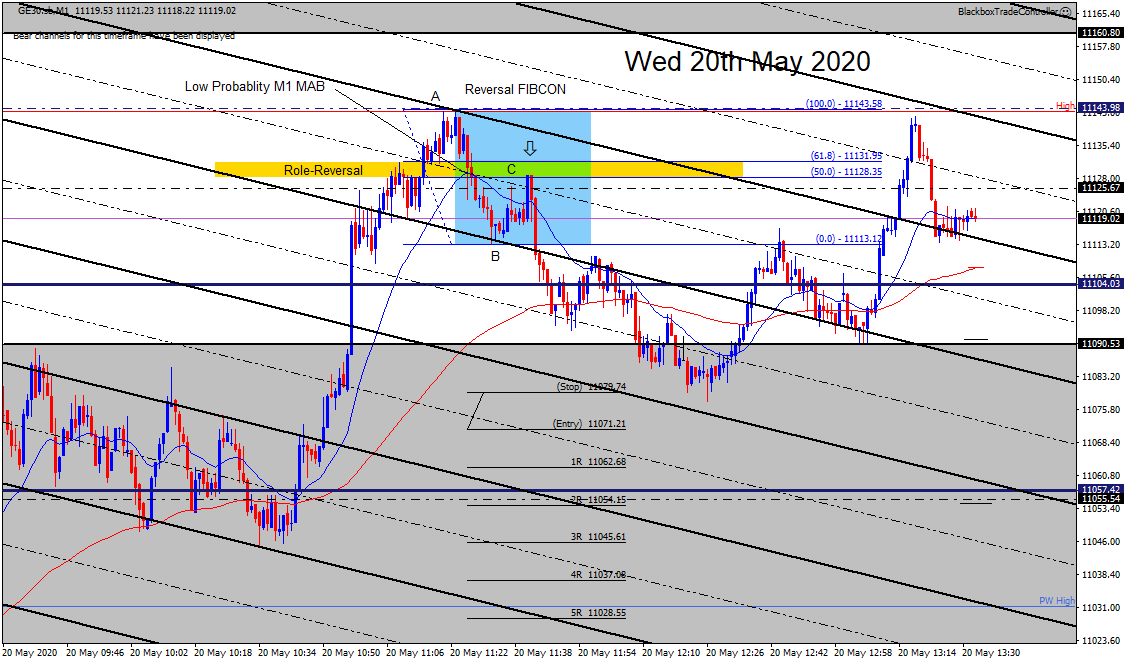
The screenshot below shows the same chart with the M1 Bear Equidistant channels overlaid which could have helped anticipate that price may reverse at the 50 FIB level.
Notice how point A and point B of the setup were confluent with the Bear Channel boundaries and point C just overshoots the midline.
The screenshot below shows the higher timeframe context on the H4 chart and demonstrates how precisely price moved up to the H4 EQZ-Midline at 1114 where it found resistance as it has done in the past.
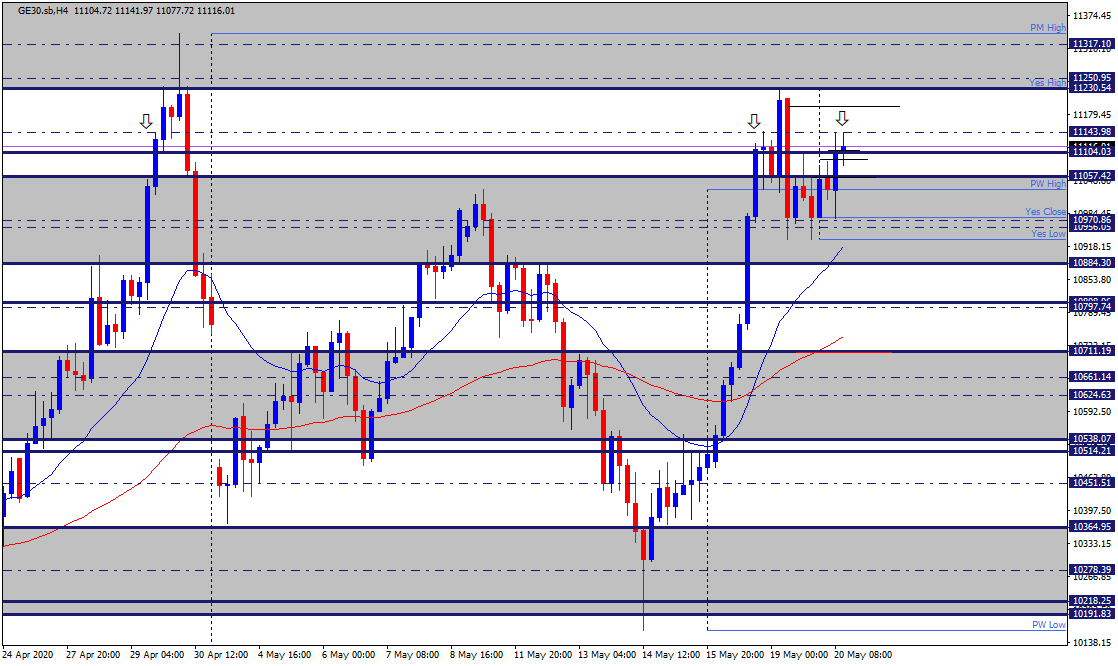
The higher context information would also have supported and assisted the anticipation of the trade setup.
The following video provides a detailed commentary on the days price action and trade setups.
14th May 2020
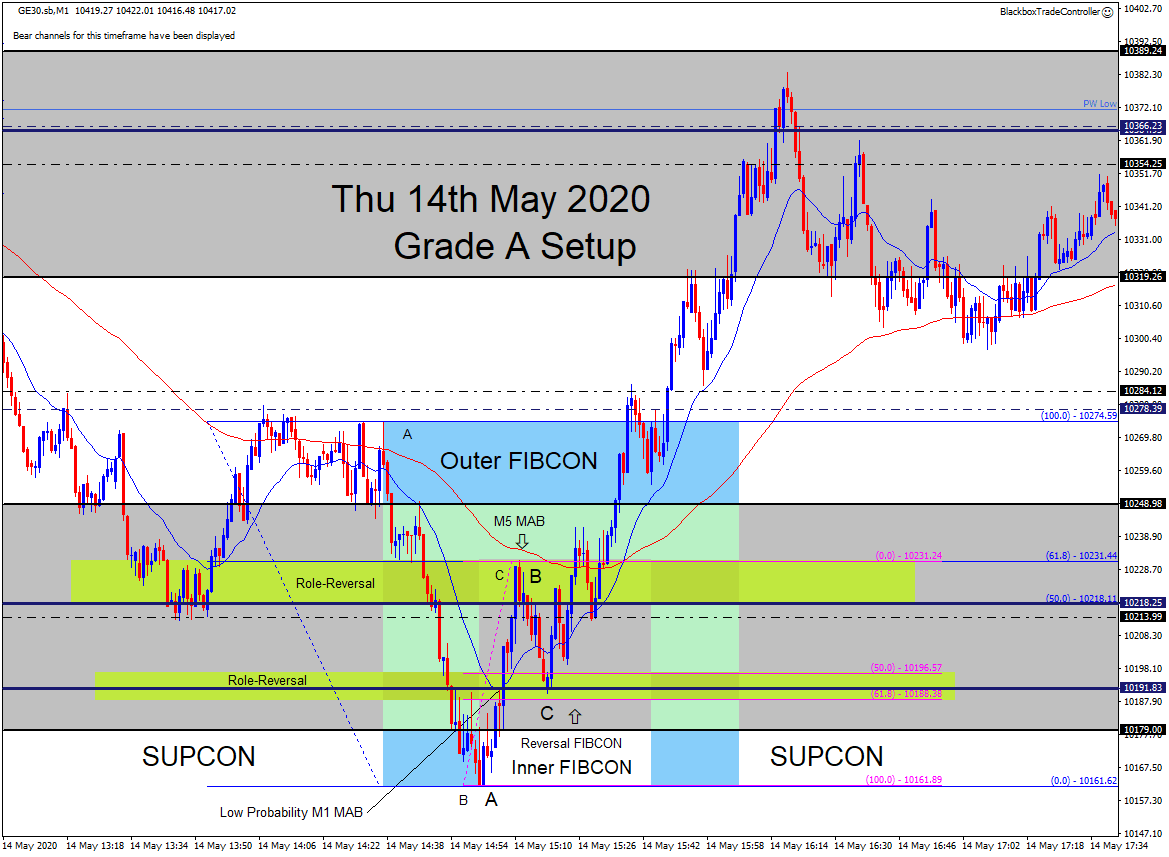
This is another example of a Reversal FIBCON Buy setup where price had moved down strongly to find support at the SUPCON zone. In this case there was enough energy to send price all the way back up to the top of the H4 EQZ at 10366 offering a multiple R trade opportunity.
Note: There was also an M5 Sell MAB on offer at point B, due to the context the M1 Sell MAB was low probability.
5th May 2020
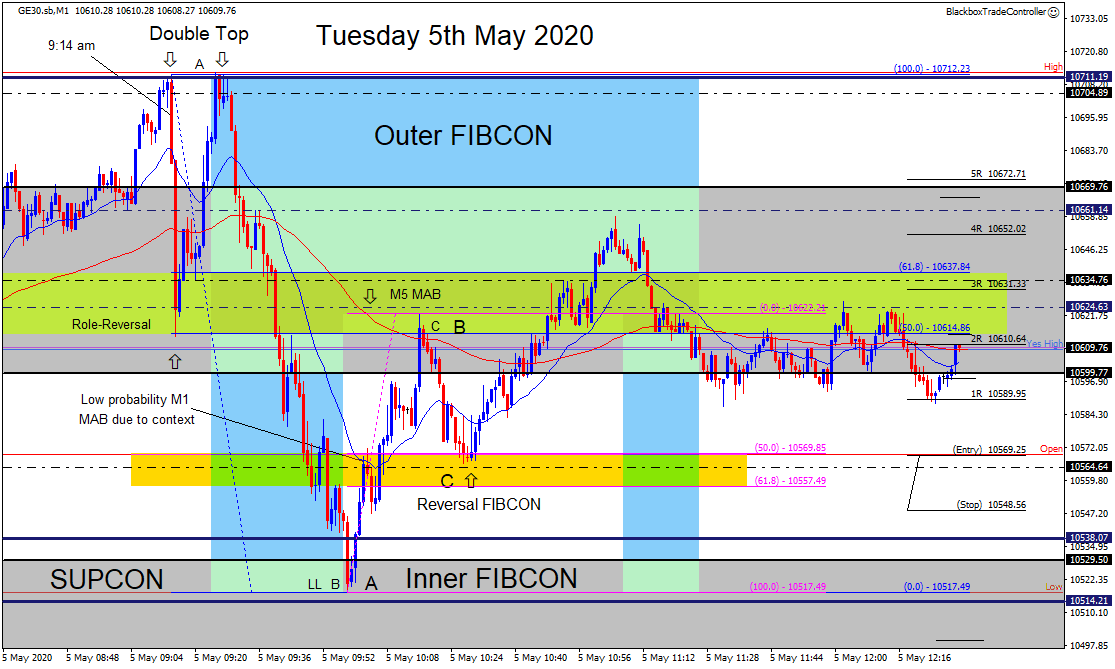
In this example price formed a Double-Top at the upper H4 Boundary at 10711 then sold off strongly down to the lower H4 Boundary at 10538, it moved briefly through it to just above the Daily EQZ at 10514.
3rd April 2020
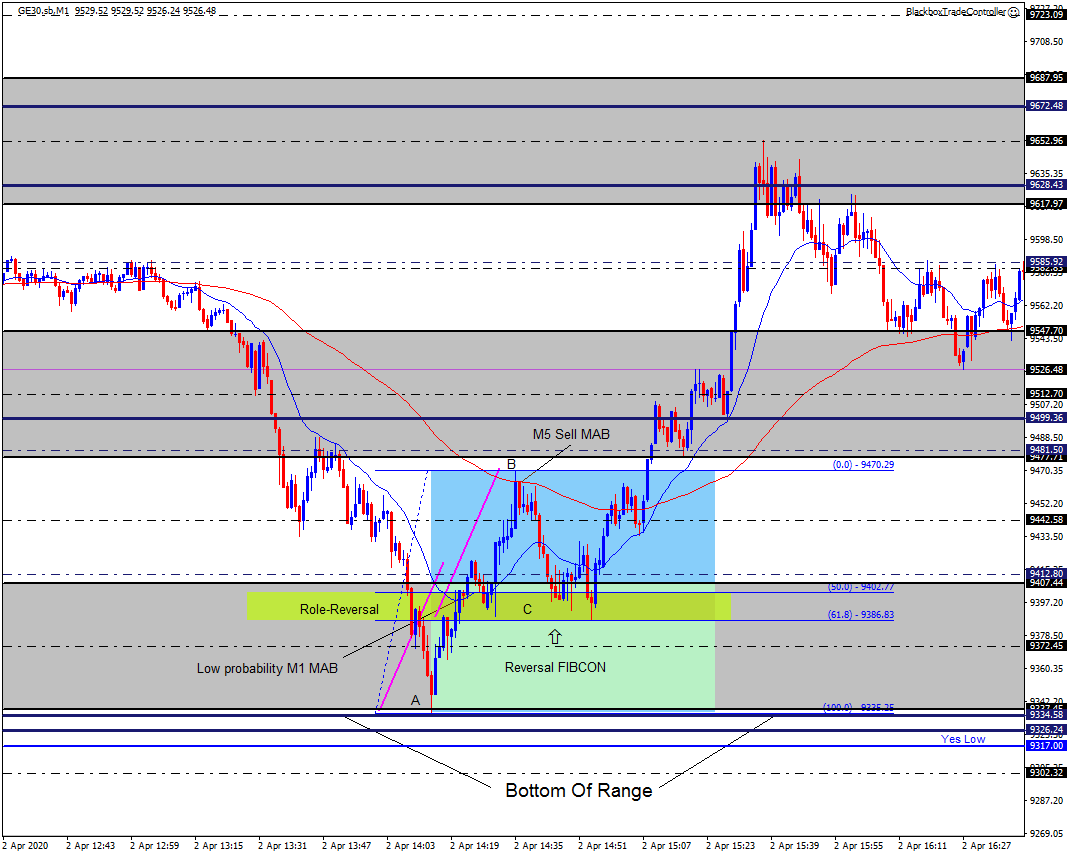
This example is very similar to the Reversal FIBCON Buy setup that occurred on the 5th May.
Once again due to context, the M1 Sell MAB is a low probability setup whereas the M5 Sell MAB offers a high probability 2R trade opportunity.
