Trade With The Energy
Before entering a trade our trading edge must be present. The A-B-C pattern on the chart must satisfy our trading plan rules to qualify otherwise we pass and wait for the next setup. It is vital that we do not overthink this part of the process and remember that:
“There is a random distribution between wins and losses for any given set of variables that define an edge.” Mark Douglas – Trading in the Zone.
Professional traders have learned to think this way at a subconscious level and are able to act on their edges without reservation or hesitation. All subjectivity is removed since they understand the nature of probabilities and have evolved to the level where they are operating as the casino.
The style of trading we do is not mechanical and therefore we need to objectively identify our edges with discipline and consistency. The FIBCON pattern is the building block of price movement and appears regularly throughout the trading session, often qualifying as our trading edge because it has great structure and great confluence. However, to put probabilities in our favor we must endeavor to ensure we are trading with the bullish or bearish energy (a.k.a. Order-Flow) that is dominant at the time of entering the trade.
So the question becomes, “How do we do this?”
We do this by identifying which phase of the price action cycle price is currently in, i.e. “Spike – Channel – Range”.
- Spike. When price eventually breaks out of a trading range it is usually accompanied by a strong move up or down due to the buyers or sellers overwhelming each other.
- Channel. When the energy of the Spike begins to dissipate a channel forms.
- Range. The Channel eventually leads to a trading range as buyers and sellers establish what they consider to be ‘expensive‘ or ‘cheap‘ prices and buy or sell accordingly at the new levels.
- Price will remain in the range phase until the pressure builds and a genuine break-out occurs and the cycle repeats itself.
It is important to point out that this cycle takes place on all time frames and is fractal in nature. This is why it is essential to consider both the higher time frame context and the lower time frame context when trading. See ‘The Energy Of Golden Zones’ for more information.
The Spike phase will typically offer only very brief pullbacks and therefore it is not a phase we typically trade.
The Channel phase will start to produce deeper pullbacks as the energy of the Spike dissipates. These pullbacks often produce FIBCONs allowing us to trade with the energy of the uptrend or downtrend.
The Range phase also produces FIBCONs but we must apply our Trading Range Rules to ensure we are trading with the bullish or bearish energy as price moves up and down the range.
As mentioned earlier, this cycle is fractal in nature, and based on the “Laws of Multiple Time Frames” we must understand which stage a cycle is in with respect to the other time frames. For example, if we are trading an uptrend on the 1-minute or 5-minute time frame we need to know what cycle is in play on the hourly time frame since the laws of multiple time frames state that:
- The higher time frames overrule the lower time frames.
- Prices in the lower time frame structure tend to respect the energy points of the higher time frame structure.
This information supports us in setting profit targets and to expect a shift in the dominant bullish or bearish energy.
We might then decide to look for a specific FIBCON known as a Reversal FIBCON (REVFIB) that allows us to take a trade in the opposite direction. Due to the context of a possible reversal taking place multiple R might be available.
The Energy Of Golden Zones
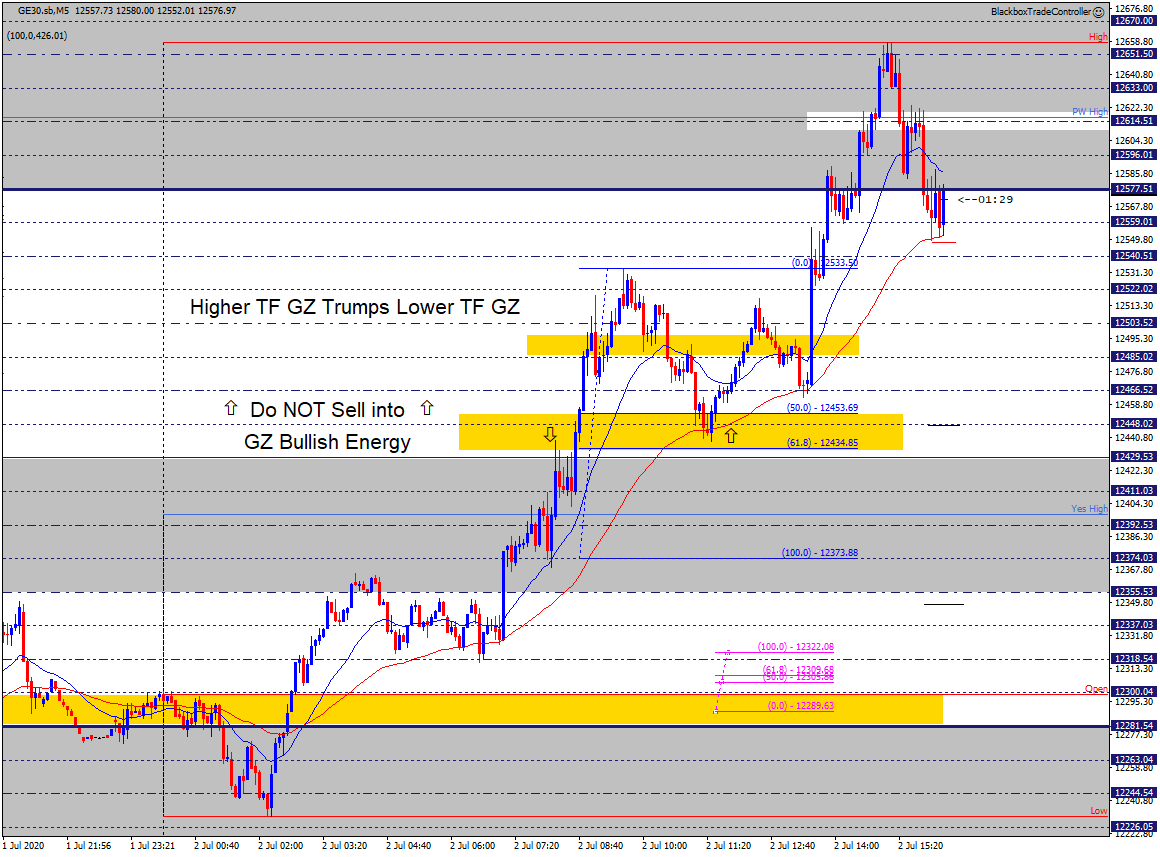
When a high-quality GZ forms it is vital to factor it into the decision-making process, the reason being is that we do not want to be trading against it. The screenshot below is a good example of this.

The move-up above Yes High produced a GZ between 12434-12453, as price was correcting (forming the B-C leg PB) a REVFIB formed followed by another sell setup at the 12485 midline. Both were good setups and had enough room to offer 2R before reaching the bullish GZ and M15 Buy MAB.
The PB (12533 – 12453) was effectively a downtrend on the 1-minute time frame, however, the “Laws of Multiple Time Frames” tells us to take any profits at the 50% (12453) level and consider switching to buy trades.
If you stayed in sell mode and entered an M5 Sell MAB at the 12466 midline following the M15 MAB the trade would have been a loser. The sell setup was decent BUT due to the context, it was low probability as you were trading against the bullish energy of the GZ and M15 Buy MAB.
The price action that followed confirmed this as the bulls were able to push price higher and target the PW High. This why we must always mark up the A-B-C patterns in real-time and use their GZs to guide us.
Trading Range Rules
When price is in a trading range there are specific rules we need to apply to ensure we are putting probabilities in our favour. A well-known axiom is “Buy Low, Sell High” which we totally agree with as you are taking a trade that offers good value.
However, we’ve gone deeper into trading ranges based on what we’ve observed when watching FIBCONs form and playout. We must try to trade with the dominant bullish or bearish energy that is present as price moves up and down the range. Therefore the following rules apply:
- Do not take buy trades in the top third of the range after price has moved up from the BOR to the TOR and is potentially moving back down. The reason for this is that the sellers will be trying to move price back down the range, therefore we look for sell trades.
- Do not take sell trades in the bottom third of the range after price has moved down from the TOR to the BOR and is potentially moving back up. The reason for this is that the buyers will be trying to move price back up the range, therefore we look for buy trades.
- Do not take trades in the middle of the range unless it’s a great setup in the direction of the move back up or down.
Since we want to Buy Low and Sell High we look for a Reversal FIBCON (REVFIB) to form at the TOR or the BOR.
Taking trades directly at the TOR or BOR can be risky due to overshoot and false breakouts. We therefore watch the price action and wait for a REVFIB to give us a valid reason to trade. If a Double-Top (DT) or Double-Bottom (DB) forms they often confirm a reversal is taking place so we trade accordingly. Experienced traders will trade DTs or DBs as they offer an opportunity to enter early.
When a clearly defined range has formed it is vital we apply these rules and principles to put the probabilities in our favour. The key point is that we want to be trading with the dominant bullish or bearish energy as price moves up and down the range.
We must also be aware of the higher time frame context. For example, a trading range that forms on the 1-minute or 5-minute time frame might be part of a reversal or continuation pattern on the hourly time frame.
Role Reversal Zones
When entering a trade we ideally want to get the optimum price just as the pullback is about to end. For a typical FIBCON, we look to see what the Golden Zone looks like in relation to other Grid structure such as midlines, MABs, and recent swing highs/lows.
Our observations have concluded that if there are recent SHs/SLs their wicks provide very precise guidance as to where the PB will end and they should be preferred over the GZ.
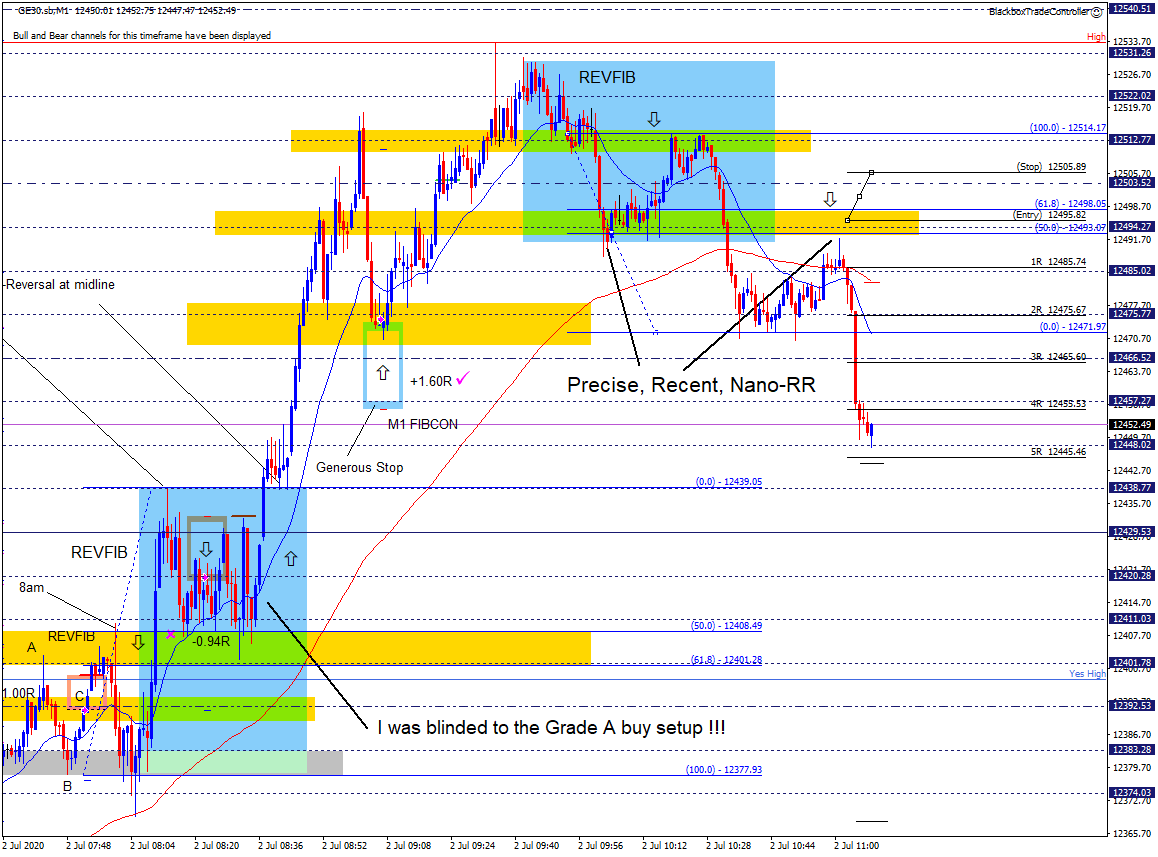
Below is an example of this. The setup is a sell FIBCON with the GZ between 12493-12498, the Trade Tool is positioned ready to enter when price moved up into the GZ. However, the recent SL produced a wick which was lower than the GZ, just below the 12494 midline.
The recent SL was enough to act as Role-Reversal sending price back down, the speed of which shows that the sellers were ready to enter. This very precise intraday (M1 time frame) Grid structure can be observed frequently throughout the session.

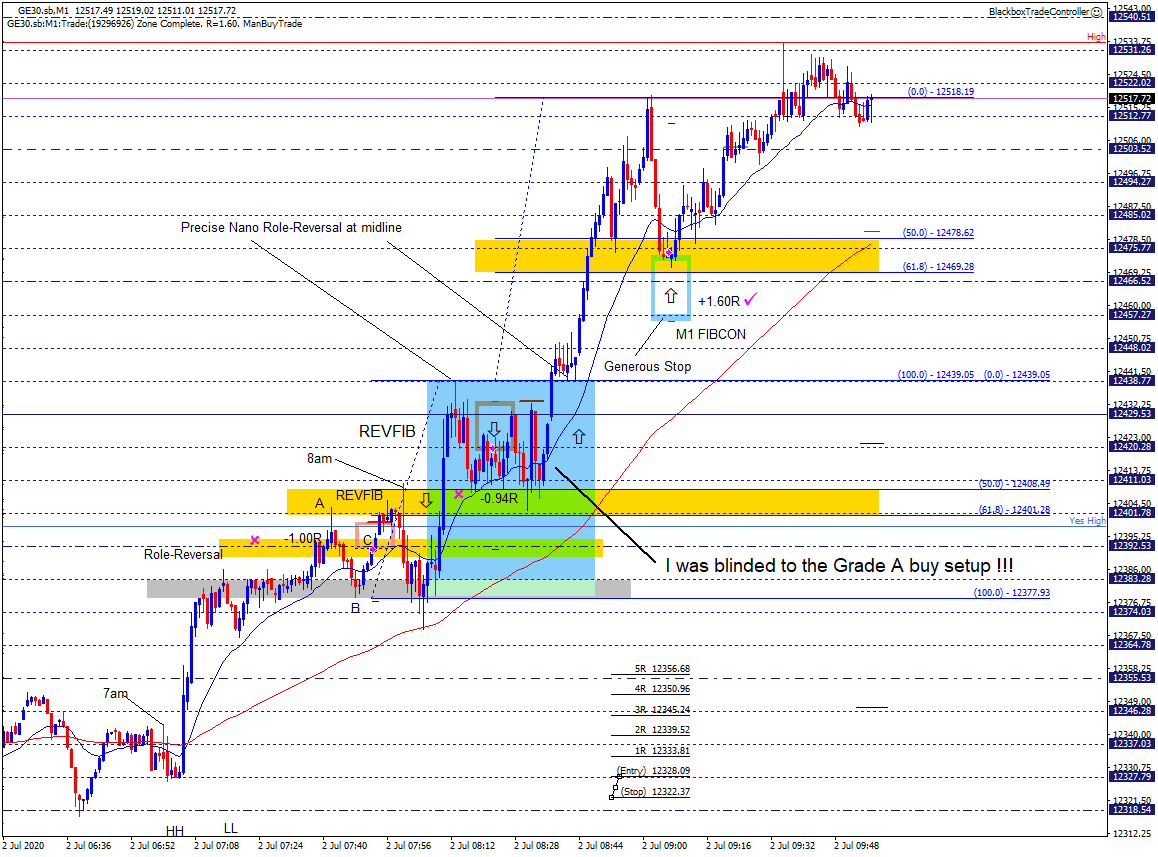
Below is another example of the precise RR Grid structure that with mastery can be used to enter a trade. The bulls pushed price up off Yes High and closed above the 12438 midline which was an earlier SH, note the perfect touch of the wick.
On this occasion, there was no clear B-C PB leg, just the precise RR at the 12438 midline. In real-time it takes Mastery to trade these but the more we see this the more likely we are to trust the Grid and take trades that offer multiple R profit potential.

