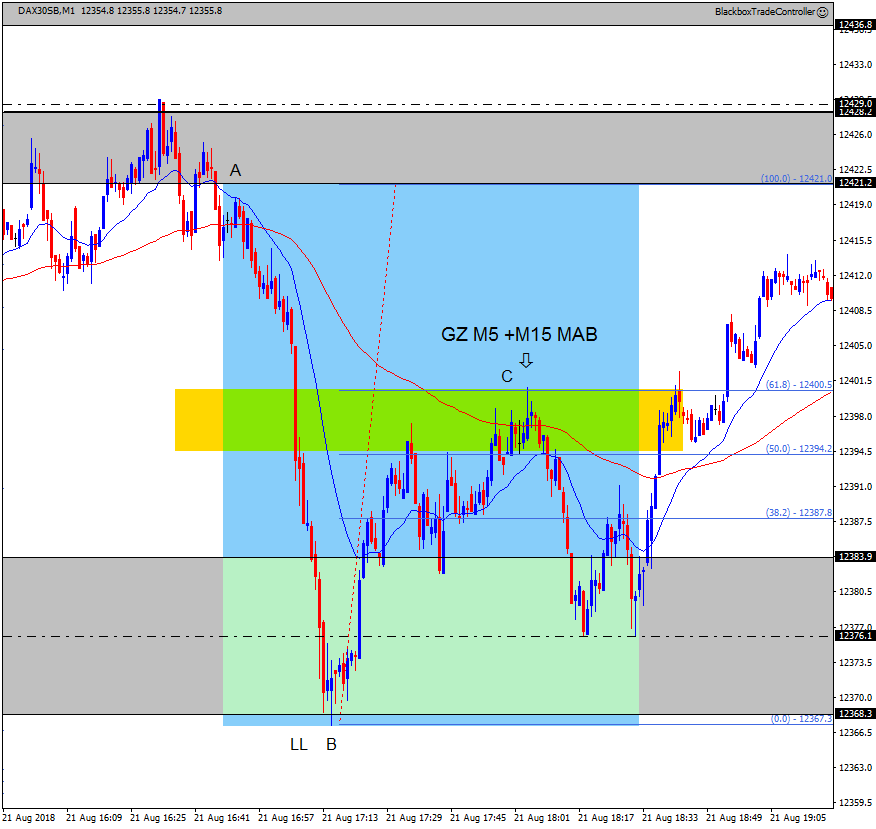
Welcome to the daily DAX commentary where we share with members our unique take on Price Action as the session unfolds. We comment on trade setups that conform to our trading edge and how we use the hybrid Blackbox Trade Controller for MT4.
Use the comments section below to post questions and read what others are saying.
Remember to:
- Follow your trading plan.
- Practice visualization techniques.
- Review and journal your trades at the end of each session.
- And above all else Be The Bear….

13:04
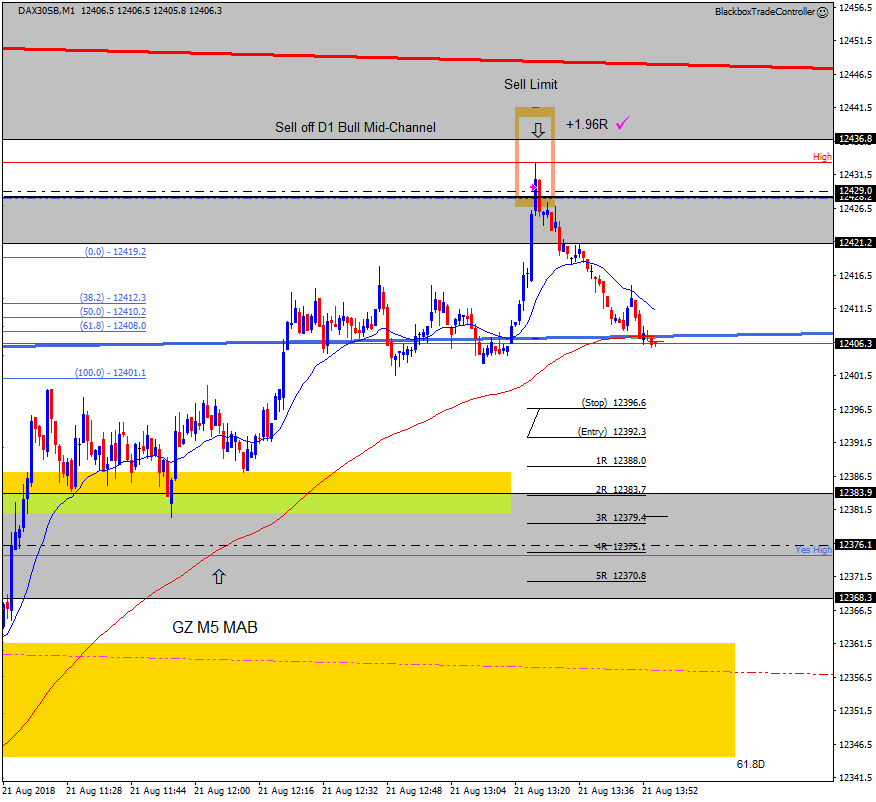
Sell Limit Winner at RESCON, +1.96R
Recently we’ve been talking about going deeper into the Price Action Grid. The only way to do this is to sit and watch price interact with each component as it moves up and down throughout the trading session.
This requires time, commitment and a routine that allows you to do this. This is therefore not for everyone but for those who vibe with this unique approach let the following be a reminder of the potential rewards available.
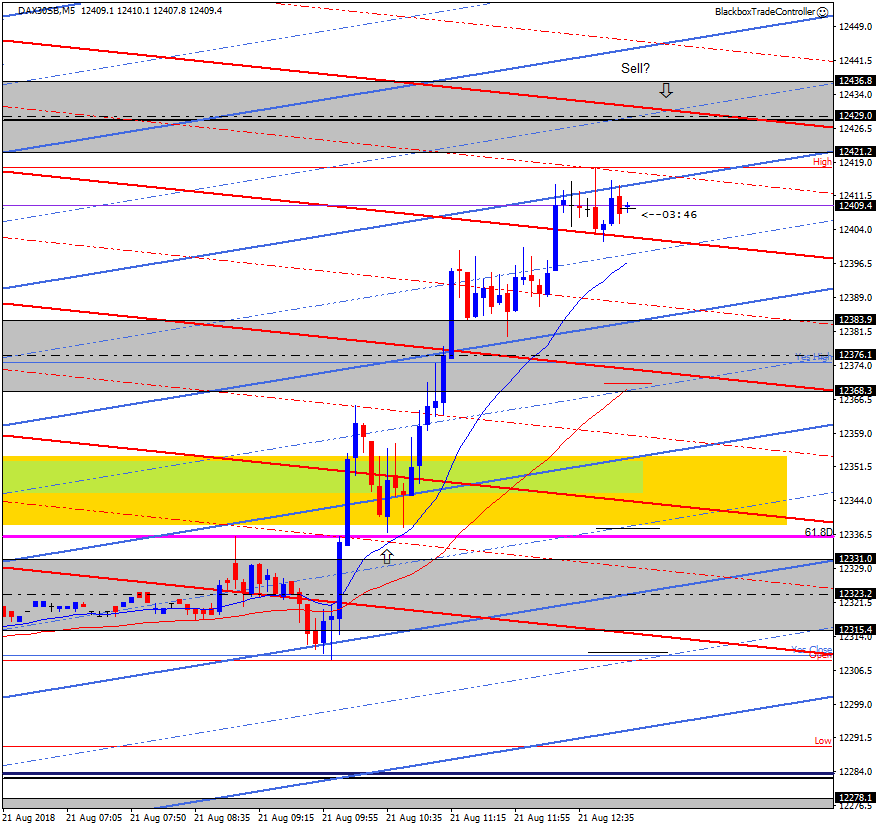
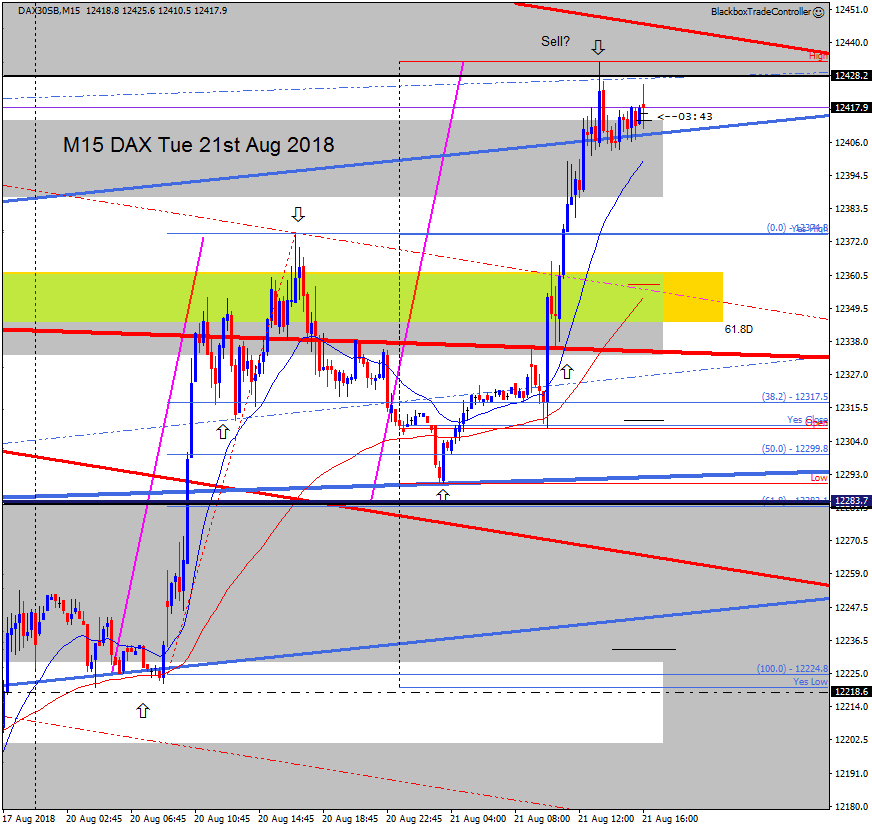
I’d identified a zone of RESCON and was waiting for price to move up to it where I was considering a sell trade. The RESCON consisted of the following:
- D1 Bull Mid-Channel. On the screenshot above it’s hidden by the H1 EQZ boundary at 12428.2
- H1 EQZ boundary at 12428.2
- M5 EQZ Mid-line at 12429.0
- M5 Bull and Bear Channel intersection, see screenshot below.
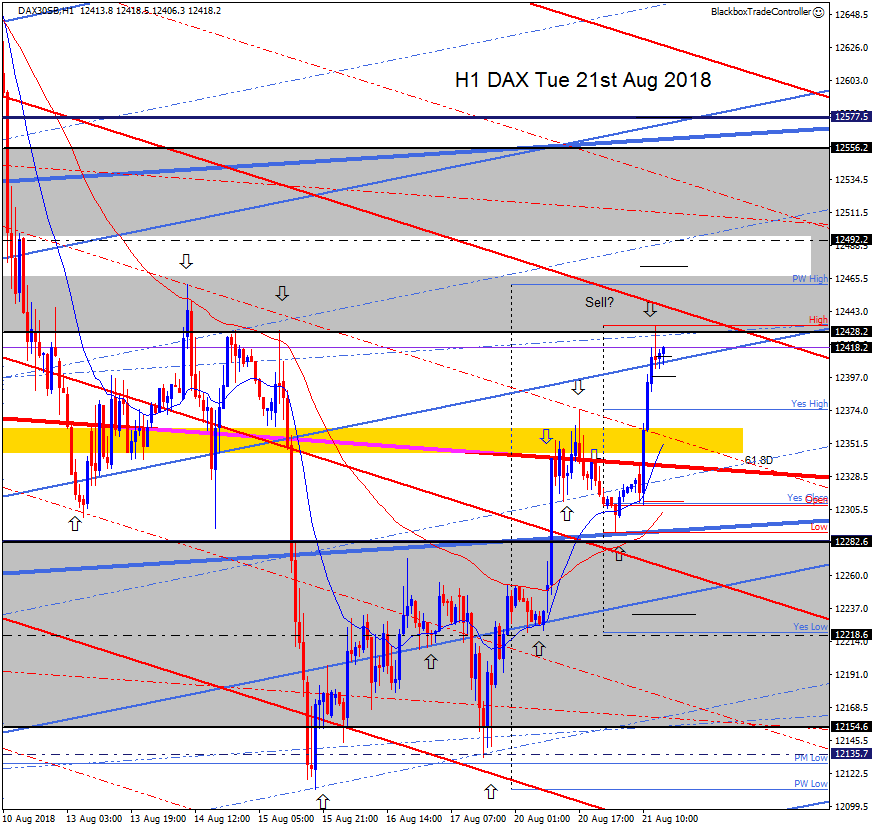
The H1 EQZ level when viewed on the H1 chart (see below) showed how precisely it had held price last week.
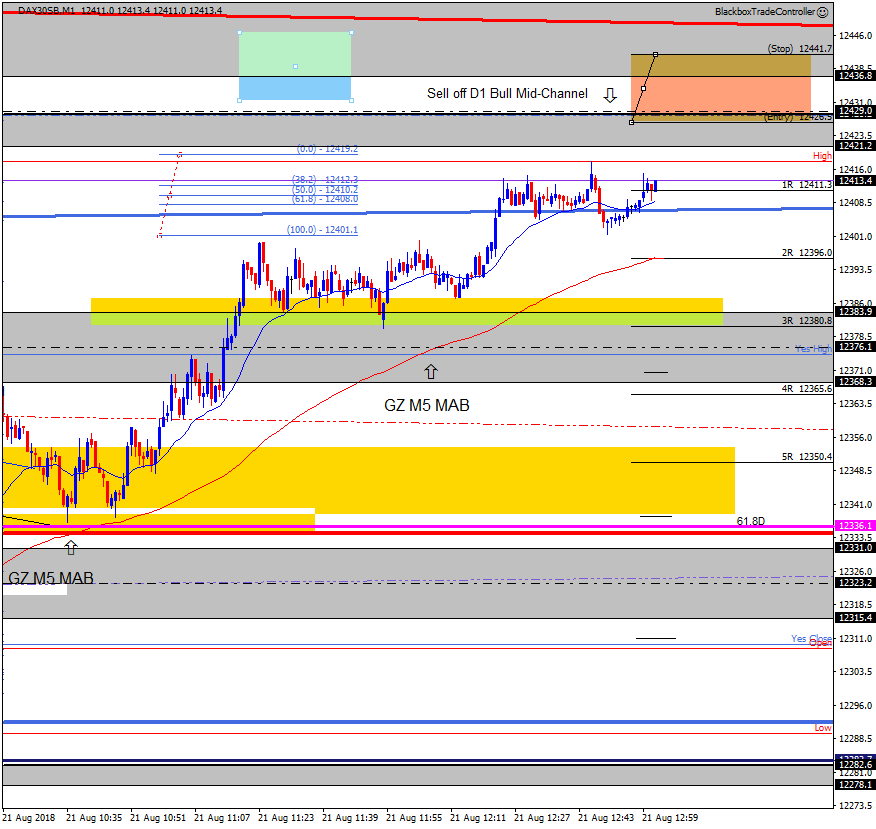
I had to leave my desk and decided to use a Sell Limit PO to enter the trade rather than miss it. There are four screenshots below with arrows showing the Sell at RESCON:
- M1 Chart. This shows the Sell Limit PO, I used a wider stop-loss than normal to allow for overshoot. This meant my 2R was at 12396.0, however, due to the slippage that occurred when triggering the PO the 2R ended up right on the H1 Bull Channel 🙂
- M5 Chart. This shows the M5 Bull and Bear Channel intersection along with the M5 EQZ mid-line and the H1 EQZ level.
- M15 Chart. This shows the same levels along with a measured move projection. See the magenta coloured lines and how the top of the second one is at the area of RESCON.
- H1 Chart. Look-left to see the previous times price moved up to the H1 EQZ level at 12428.2. Arrows are used to show how precisely the Grid channels price.
These screenshots show how important and powerful the different perspectives each timeframe provide are. They also demonstrate how the Trade Controller environment allows the user to overlay the Price Action Grid in anyway they find useful.
We are currently updating the Price Action Grid section of the website to reflect all of this in more detail.
M1 chart below.
M5 chart below.
M15 chart below.
H1 chart below.

