10:01
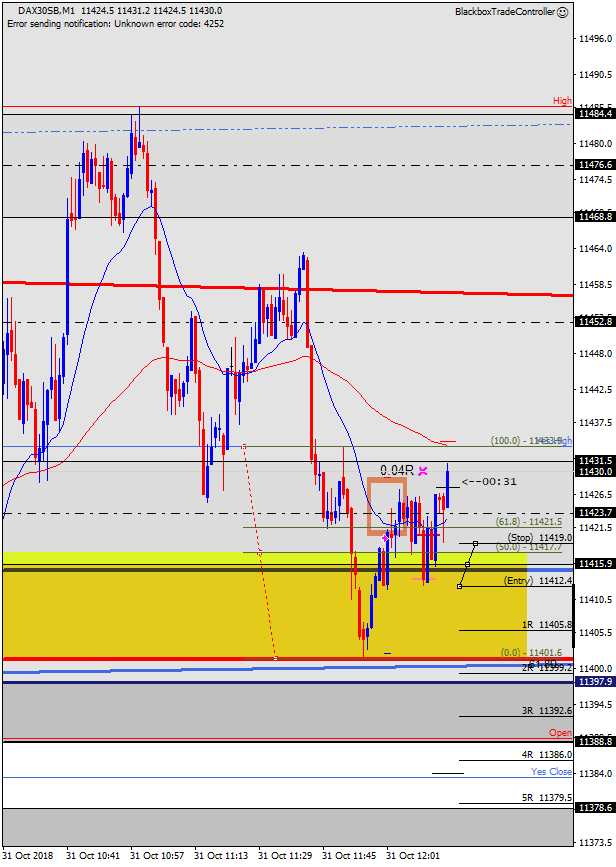
GZ M1 Sell MAB -0.04R
Even though price was coming off the Daily Channel acting as support, I wanted to give this setup a try. The M1 Moving Average was pip perfect confluent with the 61.8 level of my FibTool, and there was the M15 moving average and the 11423.7 level offering good retracement options.
I suffered the whole trade. It didn’t happen as expected. However, thanks to Mr. Phi’s (Blackbox) great idea of incorporating the Lock-In profit tool (my favourite to manage trades), I managed to get out of the trade at breakeven once price couldn’t stay below the Daily Bull Channel boundary.
09:14
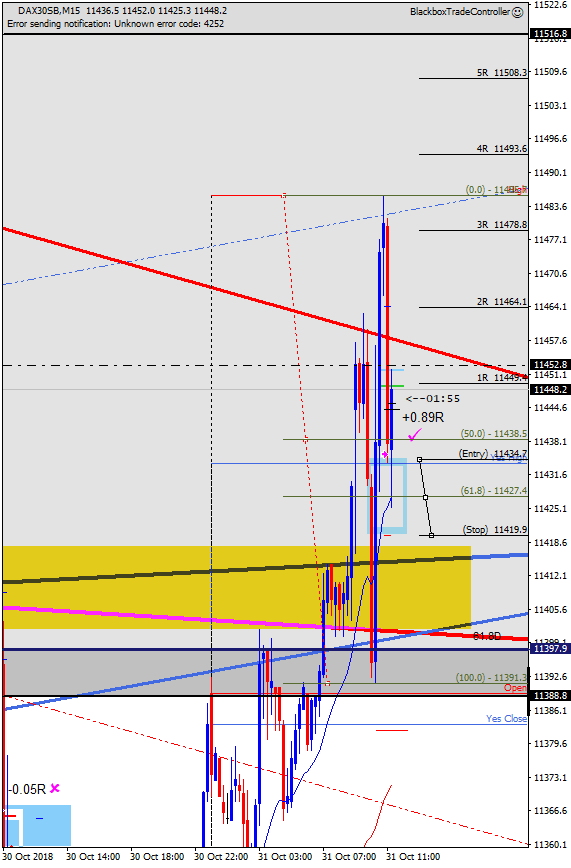
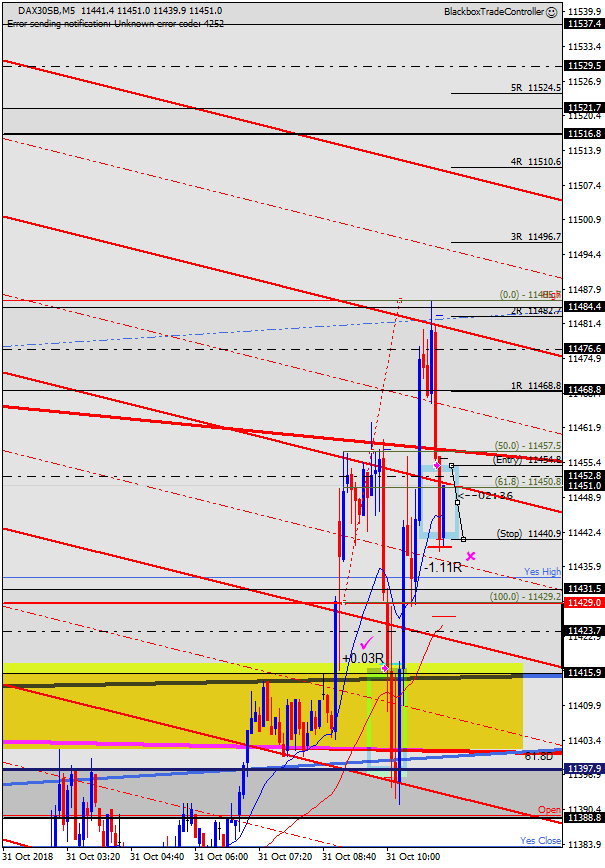
GZ M15 Buy MAB +0.89R
As I said in my previous trade, I had marked both this and the other one. The normal behaviour should have been to wait patiently for this setup but now, conditioned by my previous loser, I entered a good setup in a bad place so I couldn’t make the most of it.
A perfect entry was that of themabtrader shared by him here, well done to him!
In my case, as I wasn’t happy with my entry level, once price tested the 11452.85 level I locked profit at 1R to make sure I recover my previous loss, skewing the trader’s equation 🙁
The trade would still be ongoing and reaching +1.9R as I type.
Anyway, I’d take this trade again, probably at a better level.
08:02
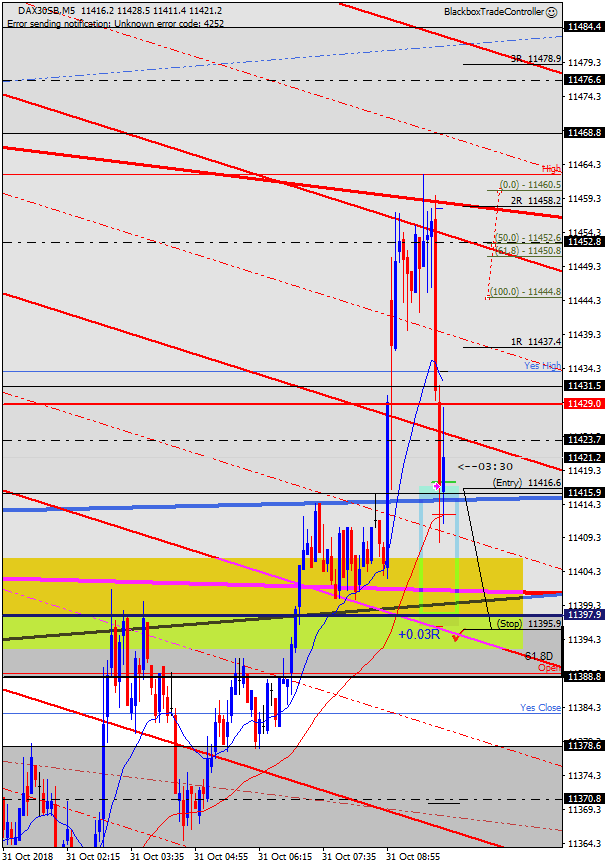
M15 Buy MAB +0.03R
Early trade after the London open. I liked the possibility of a rebound in an area that acted as resistance before the 7am open, supported by the M15 moving average.
However, the area didn’t hold so I looked for an exit at breakeven. Minutes after that price went towards the Open level, area where it seems to have found support to go back up.


We had exactly the same entry and process of thinking for that M1 MAB!
I agree that the price action isn’t very clear at the moment and I’m getting more hesitant about entering a trade.
Hi Guys,
Just got back home and am going back out but I’ve just taken a quick look at what’s happened and noticed you both took the same GZ M1Sell MAB at 10:02ish.
Structurally it was very good, it was the context that made it low probability.
However, note that price did start going down BUT guess what?
It reached the Golden Zone of the Inner-FIBCON then moved on up. It’s SO easy to see this afterwards, not easy in real-time BUT keep marking up the Outer-Inner A-B-C patterns as they form and asking:
“What’s the context?”, “Does this look good” and if it’s a range day/period “Where is price in the range?”, “Is it coming up from the bottom (SUPCON), or coming down from the top (RESCON)?”
https://blackboxsoftwaresolutions.com/wp-content/uploads/2018/10/dax30sb_M1_31oct2018_1205_xxxxxxxx_xxx_m1-inner-fibcon.gif