Pure Price Action Patterns
We trade several specific pure price action patterns as detailed below. These patterns form as price moves up and down through zones of support and resistance.
When the rules have been satisfied for each trade setup and so long as the context is valid we enter the trade looking for at least a 2R setup.
Reversal FIBCONs (REVFIBs)
REVFIBs are FIBCONs that form when price reaches a zone of support or resistance and is forced – at least temporarily – to reverse.
The Reversal FIBCON Examples page describes REVFIBs in detail along with their rules.
Double Tops & Bottoms
It is well known that the market will try something twice before giving up, this is what produces the price action patterns of DTs and DBs. When price reaches a level or zone of support or resistance it will often try at least twice to break through it. If the second attempt fails price will often reverse (sometimes only temporarily) and will often produce a FIBCON setup.
They can either be Reversal FIBCONs or Trend Continuation FIBCONs (TCFs) and if they follow a clear DT/DB they have a higher probability of success. The reason is that at least in the very short-term the DT/DB signifies a change in control between buyers and sellers.
Note: The DT/DB levels are rarely exactly the same level but so long as they’re close and at Grid structure and the context looks good the pattern is valid.
The rules for DTs and DBs are as follows:
- They must be clear and stand out, i.e. there is “white space” between each touch.
- Each touch must be of a similar level. At times they will be the same level but most of the time there will be a difference.
When a high-quality DT or DB forms we want to see a strong reaction to the second touch. We are looking for a REVFIB or FIBCON to form and the stronger the reaction the higher the probability is of the FIBCON working out.
This is due to the release of energy following the failed second attempt to break through the zone. The sellers/buyers give up – at least temporarily – allowing price to move quickly in the opposite direction. If a FIBCON forms the momentum will often work in the trades favor.
Note: The stronger the reaction to the failed second attempt the higher the probability that the FIBCON will work out.
Below is an example of a DT-REVFIB pattern on the M1 chart.
In this example, the DT levels were nearly identical with the pattern playing out as described above.
This one was fast-moving as it took place on the M1 time frame but structurally it was excellent and a great example of the fractal nature of price action.
Below is an example of a Double-Bottom Trend Continuation FIBCON (DB-TCF).
Above is an example of a DB-TCF shown on the M5 chart. After making the session High price briefly retraced and found support at 13480. This was confluent with an earlier RR zone that formed just after 8 am and the M15 MAB shown by the red MA.
The key points are:
- A DB formed at the M15 MAB, look left to see the RR zone that also supported price.
- A HH at 13515 followed the DB, look left to see the earlier SH at exactly the same level.
- A PB followed, it reached exactly the 50% level of the FIBCON’s GZ.
- Price then moved up strongly to set a new session High.
This is a great example of how much energy is released by a DT or DB.
Below shows a DB that formed on the M5 chart but is not followed by a classic REVFIB.
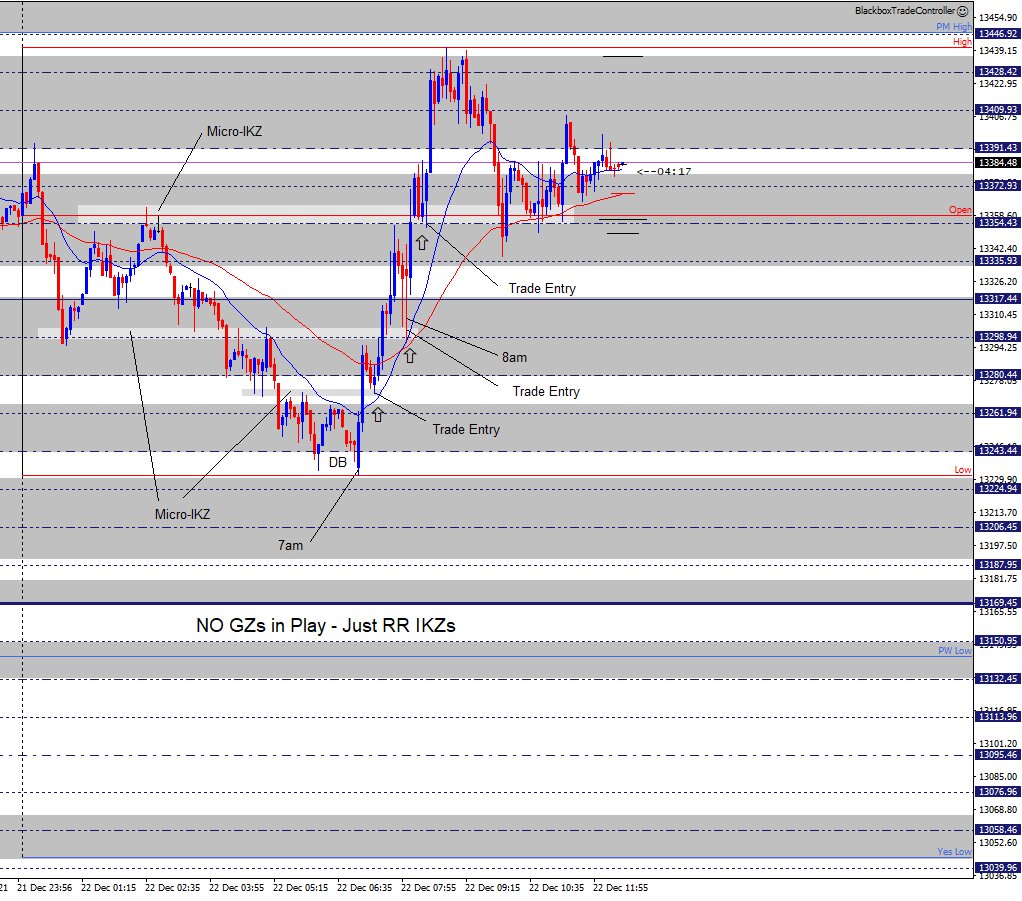
The M5 chart above shows a DB that formed at the 7 am European Open. Price moved up strongly off the session Low, this is a very strong indication the bulls are looking to move price higher.
On this occasion, the PB did not produce a FIBCON but there were clues as to where price might find support before continuing on up. Note the micro-IKZ (Intraday Key Zone) the PB reached, it had excellent RR structure that formed on the way down prior to 7 am.
As Pure Price Action traders, we must mark up these micro-IKZs as soon as the wicks show us where they are. This skill must be practiced and mastered!
Some days the price action will not produce classic A-B-C FIBCONs with Golden Zones, however, when there is a retrace (PB) to Grid structure such as the IKZs shown it is possible to enter a trade as shown.
Below is an example of a DT-REVFIB.
Above is an example of a DT-REVFIB pattern on the M5 chart. The move-up off the Low at 8 am initially produced a perfect DT before testing the EQZ@13761. The pattern was still a valid DT which resulted in a strong sell-off back below the Open before retracing back up into the GZ.
The GZ had great RR due to a DT that formed overnight between 1-3 am.
Below shows two DT-REVFIBs.
The M5 chart above shows two DT-REVFIBs. The first one followed the 8 am open and reflects the injection of energy by the London traders. The second was in the afternoon when price tested the High which was set by the first one.
Note how the same levels are in play for both DTs.
MABs
A full description of MABs can be found in the MABs and FIBCONs section, here we will describe MABs where there is no classic A-B-C with Golden Zone but a valid trade setup is present based on our rules supported by Grid structure.
Above is an example M1 buy MAB that formed after price moved back above the Open. There was no A-B-C GZ in play but the existing Grid levels and IKZs provided support structure.
The rules for taking these type of MABs are:
- There must be a clear impulsive move that stands out.
- Wait for price to PB to existing Grid structure.
- Look for the presence of buyers, the wicks tell us where they are!
- In this example, the top of the IKZ@13705 was where the buyers stepped back in.
- When the M1 MA caught up with price it provided the energy to continue the move up.
The pattern highlighted is a ‘Bull Flag’, this is a pure price action pattern. At least two tests are required to confirm the PB level and the presence of buyers.
Also, note that another M1 buy MAB followed when price retraced to the SH of the impulsive leg at 13724