Reversal FIBCON Examples
This page contains links to examples of Reversal FIBCONs and demonstrates how they are captured within the Price Action Grid. The Reversal FIBCON or REVFIB chart pattern occurs repeatedly across all markets and all time frames.
As mentioned previously, REVFIBs have at least a 2R profit potential but typically they offer multiple R trade opportunities since they mostly occur when price reaches an area of major support or resistance such one of the higher time frame zone boundaries or the top / bottom of a range, so when in play they can prove to be extremely profitable.
Identifying and marking them up on the chart retrospectively is easy, anticipating and trading them in real-time is not so easy!
After the event everything appears in black and white but in real-time what we have to work with is more like shades of grey.
We recommend that you first read the Blackbox Trading Edge section then we encourage you to spend time studying the examples provided in detail. As with all things worth learning, it takes time, effort and commitment to develop the skills required to master them.
The accompanying commentary and analysis of these trade setups is an example of what can be expected if you choose to join us and become a member of our trading community. The charts have been marked up using the Blackbox Custom Chart Objects.
These examples explain the concept and demonstrate the power and potential of Reversal FIBCONs.
REVFIB Rules – Valid and Invalid Setups – Part 1
The following section details the importance of rules when trading REVFIBs. With trading you can wing it and be lucky and have winners BUT you will not go on to be a professional who demonstrates consistency and profitability!
The following rules apply to BUY REVFIB setups, SELL REVFIBs are similar:
- They must take place at the bottom of a clearly defined range or Grid structure that supports a reversal. Use the higher time frame Grid structure to determine the strength of a possible reversal zone.
- The M1 sell MAB will either be low probability and fail OR produce a Double-Bottom (DB). We therefore do NOT trade it, we let it produce the DB or fail as price moves up to produce a clear Higher-High (HH) at point B.
- After the M1 MAB (that may have produced a DB or failed) there must be a clear impulsive A-B leg to form a HH at point B. This HH MUST stand out against the recent price action.
- The best HHs are often M5 sell MABs.
- The GZ must look good and include clear Role-Reversal (RR) structure.
Use existing Grid structure on the M30/M15 charts to assist in determining stop loss placement.
Enter the trade when price retraces to the GZ. You never know if price will fully test the GZ, sometimes it will touch the 50% level and shoot up. Other times it will test the GZ over several minutes and even probe below it before moving up.
You therefore have to practice these to determine trade entry, maybe even have a rule that you only enter at the 50% or 61.8 levels using a buy limit order.
Go for the 2R until you gain experience, REVFIBs can often lead to multiple R trades due to their context being a reversal zone.
Below are examples of Valid and Invalid setups.
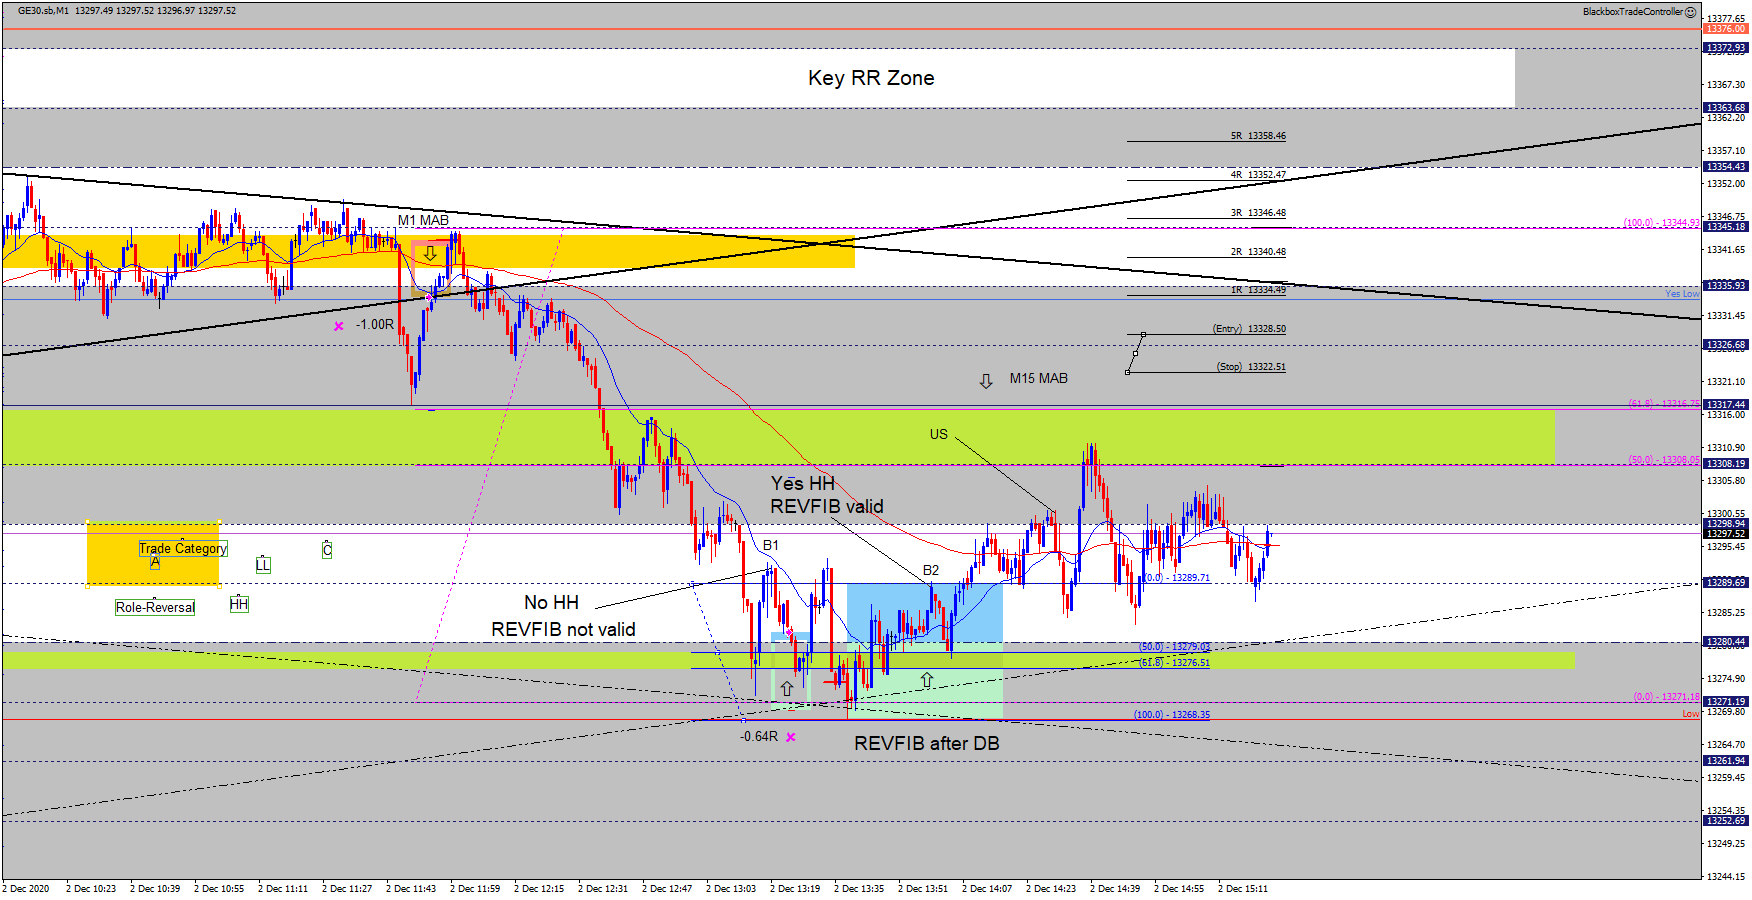
The above example took place on Wednesday 2nd December 2020, it shows why the buy trade failed as the rules were not followed.
- The move below 13280 produced the current session Low and was followed by an A-B leg to produce point B1 at the M1 sell MAB. The GZ was at 13280 – a key Grid level – the trade was entered and initially it looked good BUT point B1 was NOT a clear HH. Look what happened when price reached the B1 level again, it sold off to produce a new session Low. The trade closed out for a -0.64R loss as the stop had been moved up when the trade went into profit.
- This was therefore an Invalid buy REVFIB setup.
- The new Low produced a Triple-Bottom of sorts which was followed by a series of small HHs and HLs.
- This led to point B2 which was just below the B1 level but it was a valid HH in relation to the very recent HHs and HLs following the session Low.
- Entering at the 50% level of the GZ (13279) would have resulted in a 2R winner!
Even though point B1 stands out more than B2 it was NOT a HH at the time and the following price action confirmed the sellers were still in control.
This is a great example of an Invalid setup being followed by a Valid setup, below is another example that took place the following day.
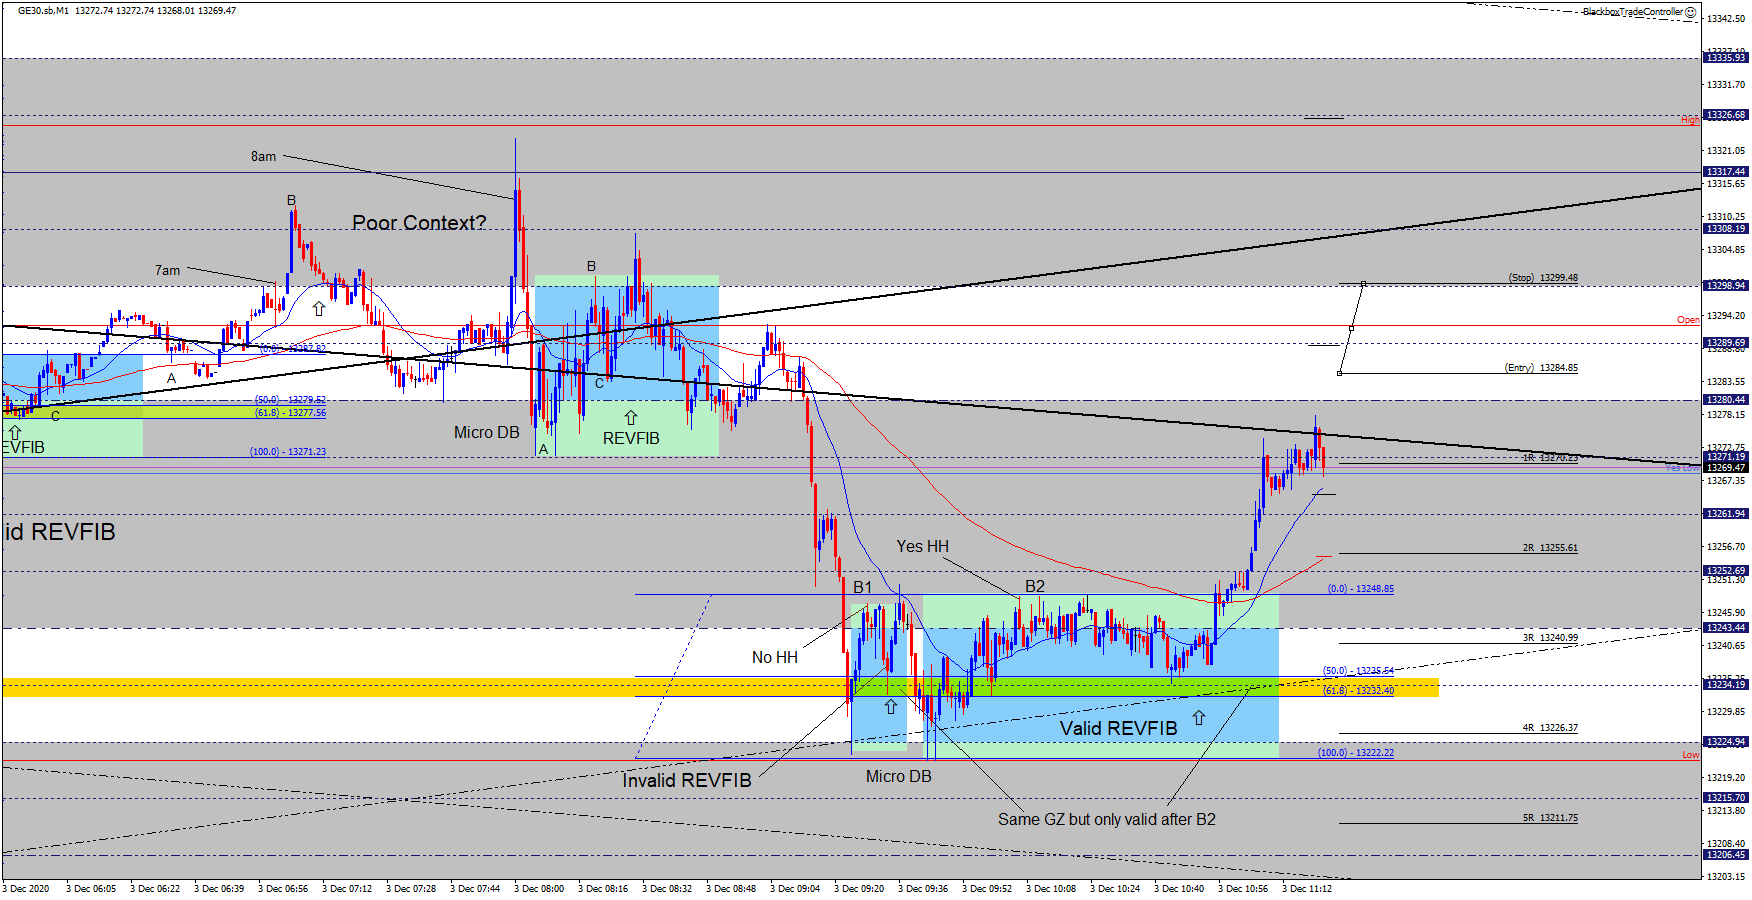
This is similar to the example above, even though point B1 did produce a GZ that was precisely tested at 13232 it was NOT a clear HH. This was confirmed by the price action that followed, an M1 sell MAB that resulted in a micro DB and new session Low.
This was followed by a series of small HHs and HLs which led to point B2 which was at the same level as B1 but it was a valid HH in relation to the very recent HHs and HLs following the session Low.
This resulted in a GZ that was exactly the same as the one produced by the Invalid setup, this is very supportive of the REVFIB buy setup.
Entering at the 50% level of the GZ (13235) would have resulted in a 2R winner!
These two examples took place when the market had a low daily range (approx. 100 pips) and highlight the need to strictly follow rules. They also show that we should anticipate an Invalid set up to be followed by a Valid one.
Knowing that this might happen can help with FOMO, if you’re tempted to enter or chase an Invalid setup close your eyes and imagine how good you will feel to see it fail and be followed by a Valid setup. If the Invalid setup goes on to be a winner we must accept that, reset, and congratulate ourselves for exercising a professional mindset knowing that this will serve us well.
REVFIB Rules – Valid and Invalid Setups – Part 2
Below is another example of a buy REVFIB pattern forming, this one shows how important it is to be patient and how following the rules will result in an entry that offers the best value and profit potential.
The three stages of this one are detailed below.
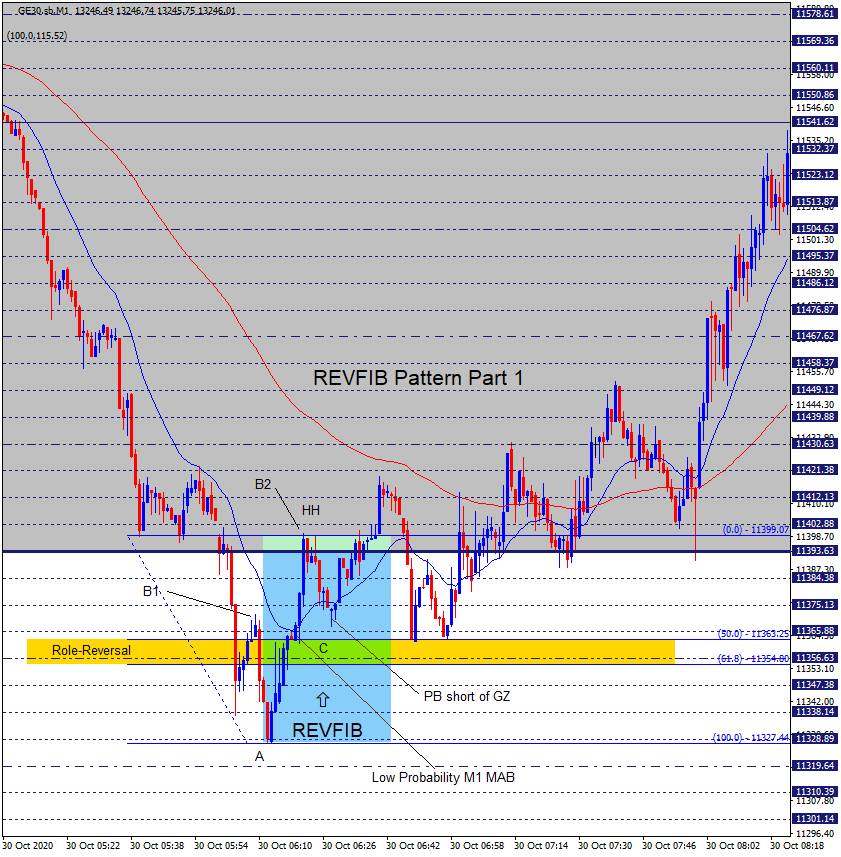
The above example took place on Friday 30th October 2020 when price moved down to the Daily EQZ level at 11393. Note the following:
- Point B1 was not a valid HH.
- After B1 price set the Low and reversed to produce B2 which is a valid HH and is therefore used to make up the A-B-C pattern and GZ.
- The M1 sell MAB was low probability due to the context as described in the rules, we do not trade these, we let them fail or produce a DB.
- The PB to the GZ stopped short.
- If you’d have chased price (FOMO) then about 15 minutes later you’d have been in trouble!
Part 2 below shows why following the rules would have prevented a losing trade and allowed you to take a high-value setup.
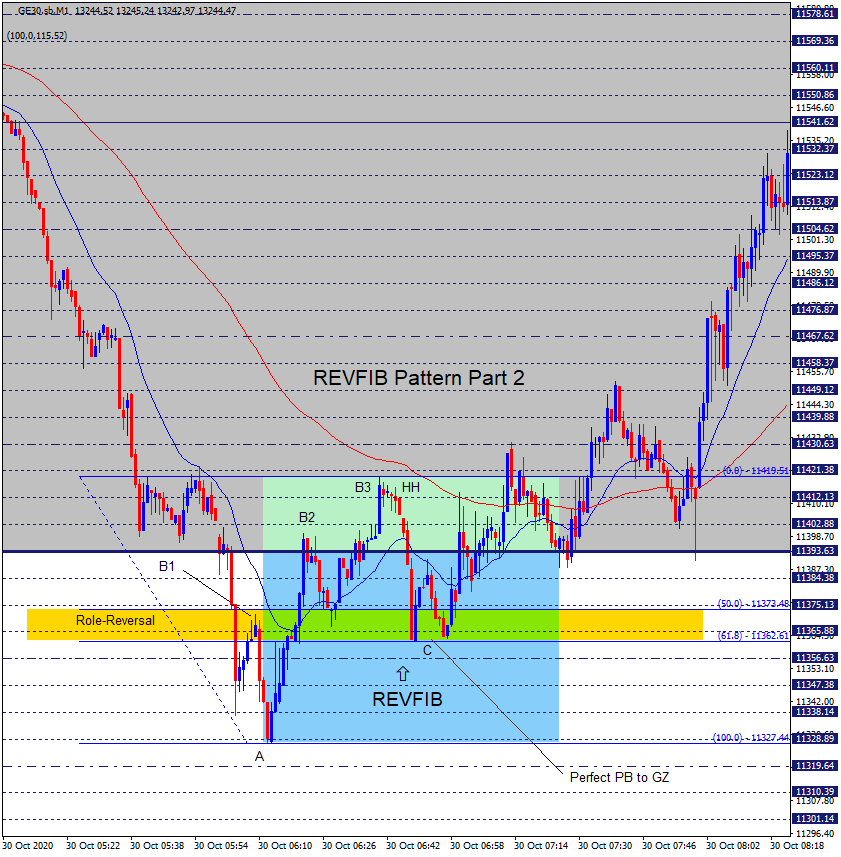
Part 2 above shows why following the rules will keep you out of trouble, note the following:
- B2 did not produce a PB to the GZ so we would/should NOT be in the trade.
- Price moved up to produce another HH, point B3 just below the M5 sell MAB, this in turn resulted in an updated GZ. Compare this one with the one using B2.
- What followed was a perfect test of the GZ, note how the red/bear candle turned on a dime at the 61.8 level. In real-time the last thing you’d feel like doing is entering a buy at the level but if you trust structure?
- This was the valid buy entry that led to price moving strongly above the 11393 level.
In real-time it’s not easy as FOMO is a powerful emotion but hopefully, you can see the rewards of following the rules – Mastery!!
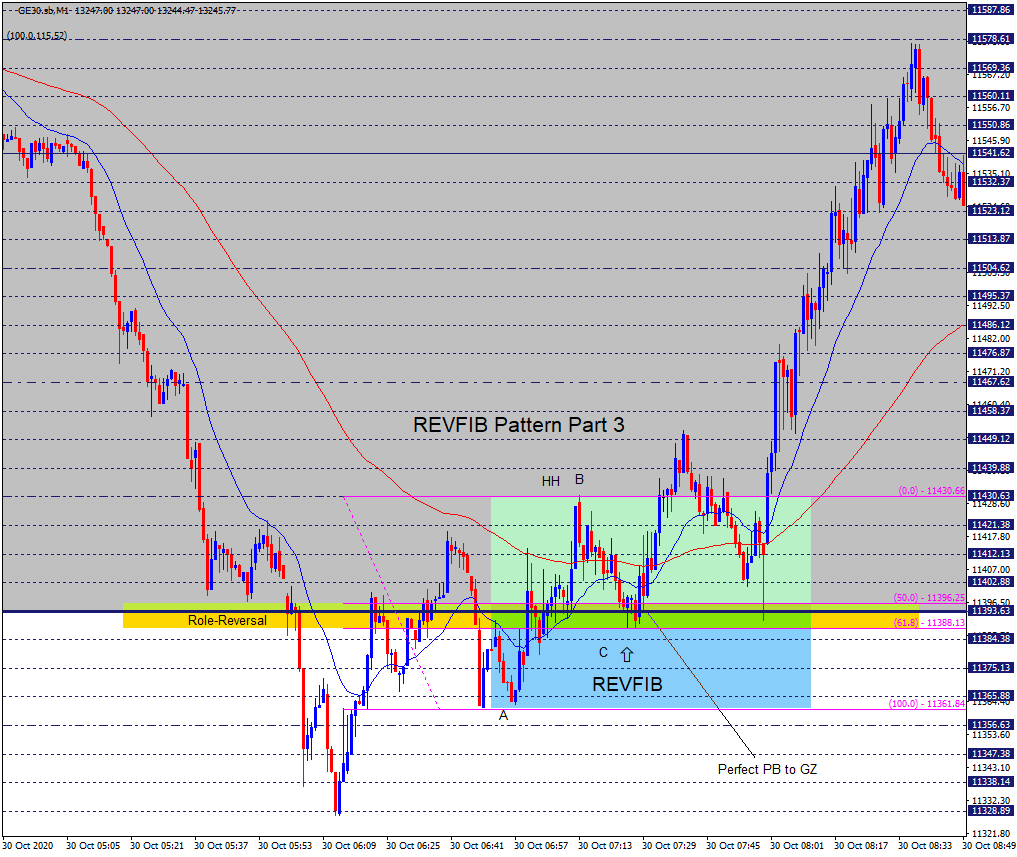
Below shows the gradual uptrend, the retrace to 11393 offered another buy setup.
Micro DT Sell FIBCON
Below is an example of a high-speed sell FIBCON that formed after a DT reversed price. It is a great example of a FIBCON following either a DT or DB. These setups require the DT (or DB) to be anticipated in advance, this micro setup could only be seen on the M1 chart.
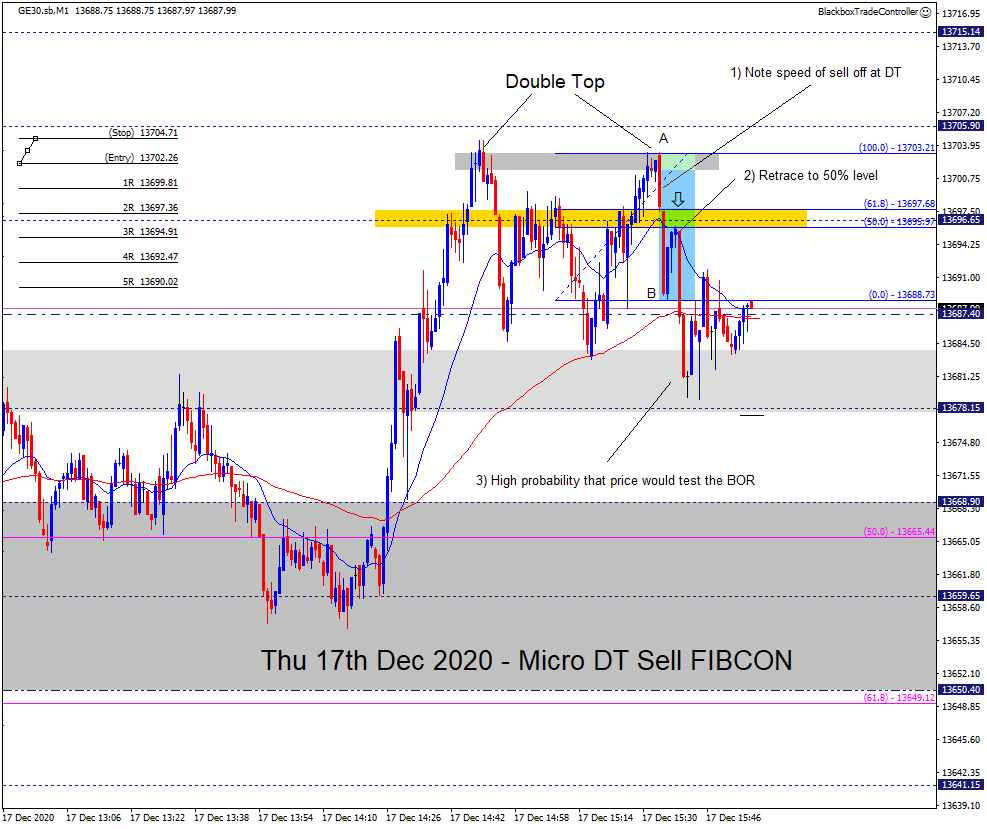
This is an example of very high-speed price action, the second attempt to break above 13703 failed resulting in a fast sell-off down to point B.
Note: Even though point B was not a LL (FIBCON rules) the context of a DT was such that there was a high probability that the bears would try to test the BOR.
It all happened in 7 minutes, the speed of the sell-off from point A to B was a clue that in the very short-term there was more selling to come.
To trade these setups we must anticipate the DT (or DB) in advance, we’re looking for a sell FIBCON in this case. Note that the PB only reached the 50% level before resuming the move back down.
If you were waiting for the perfect entry at the 61.8 level then you’d have missed this one. This setup required entering at the 50% level with a stop above the 61.8 level AND the recent wicks produced after the first attempt failed.
Micro REVFIBs
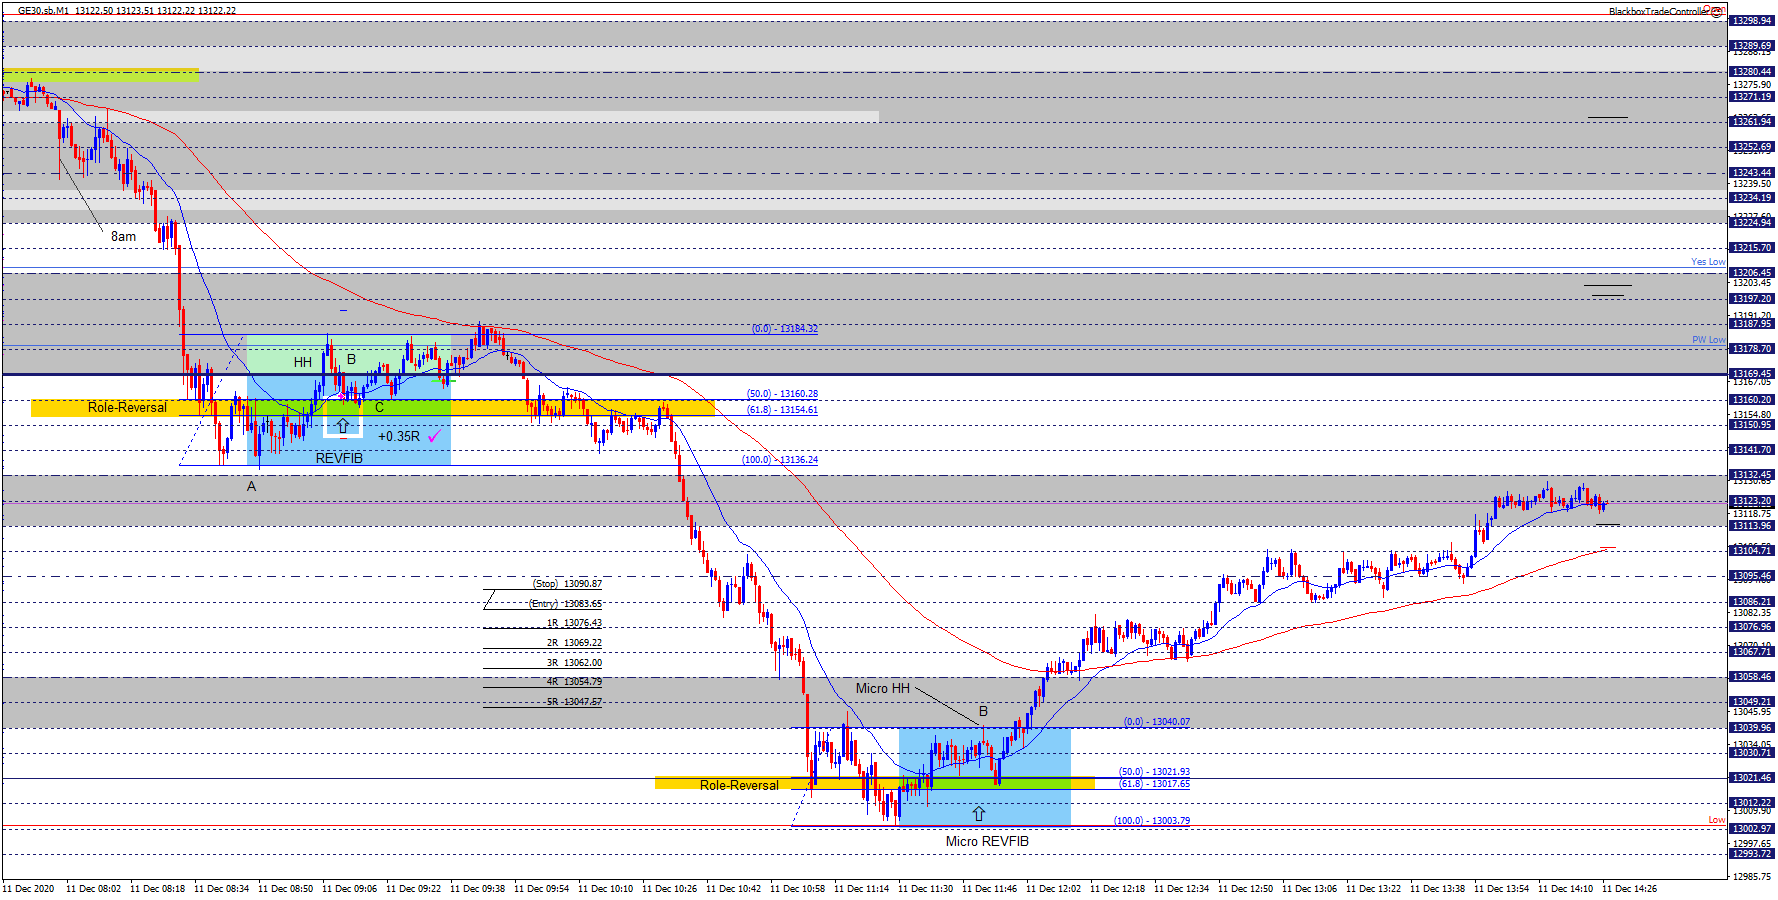
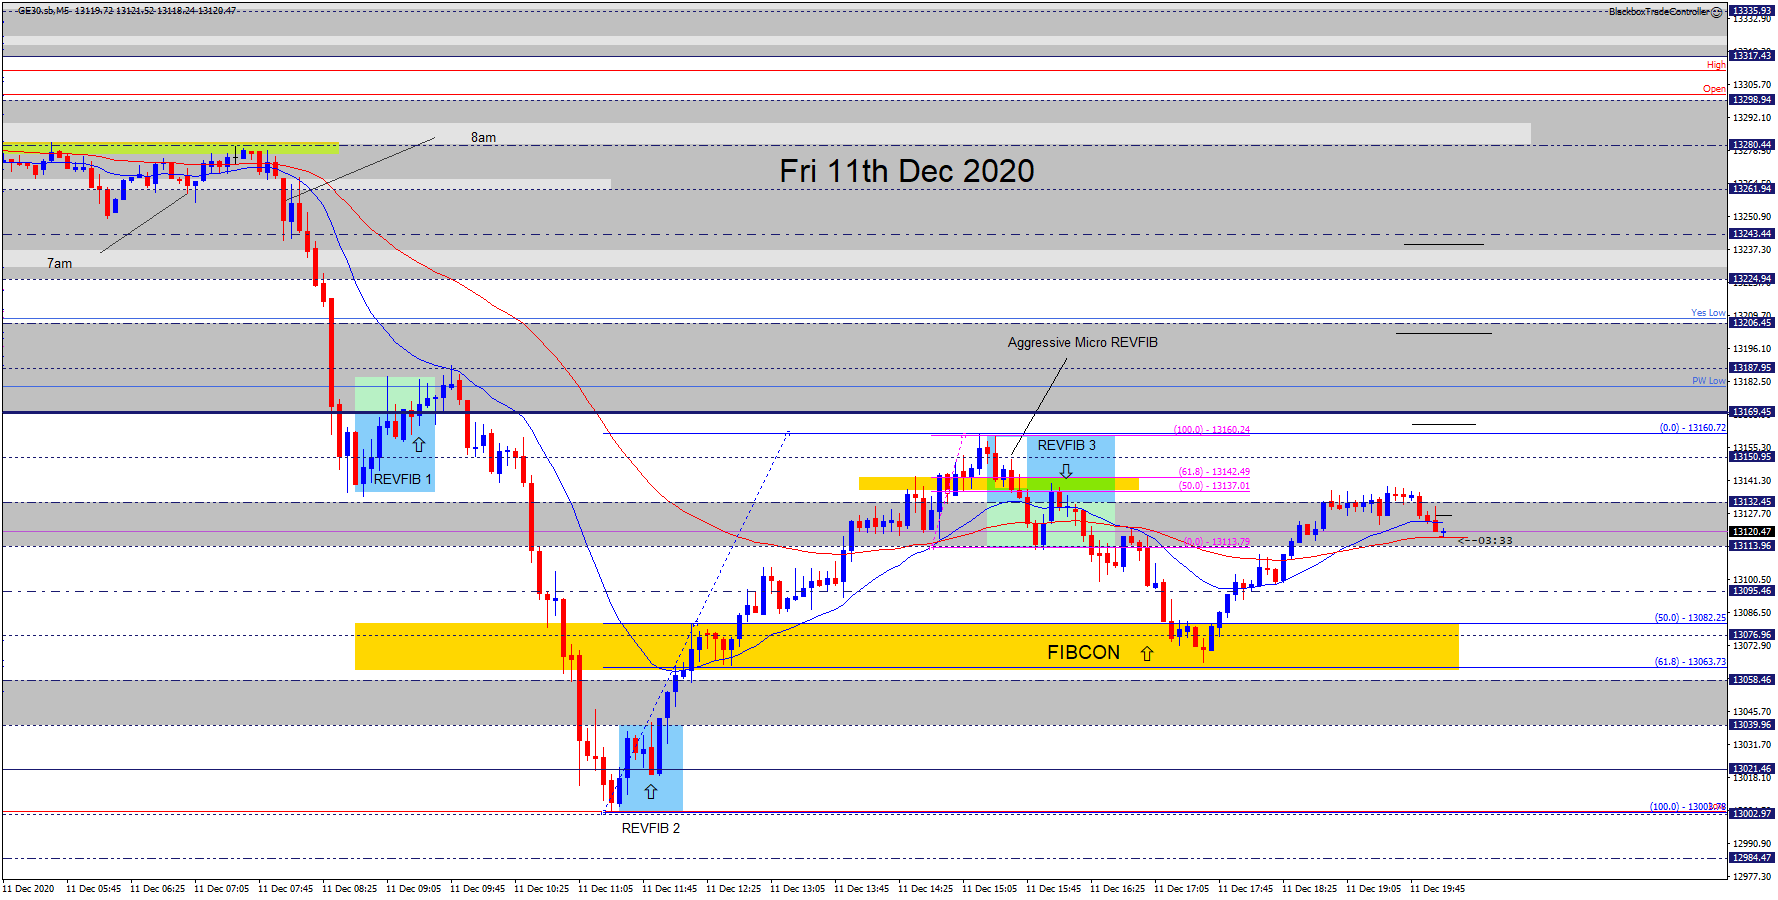
On Friday 11th Dec 2020 two buy REVFIBs formed, the first one followed the 8 am selloff down to 13169. Note that:
- There was a DB at 13136
- The M1 sell MAB failed.
- The HH was clear but was unable to get above the PW Low.
- The GZ had good RR as defined by the RECENT wicks.
- The trade was taken at the 50% level.
- The stop was trailed after the move back above 13169, this resulted in a small winner.
- The M5 MAB (red) was able to send price back down, this was a clue that the bears were still in control.
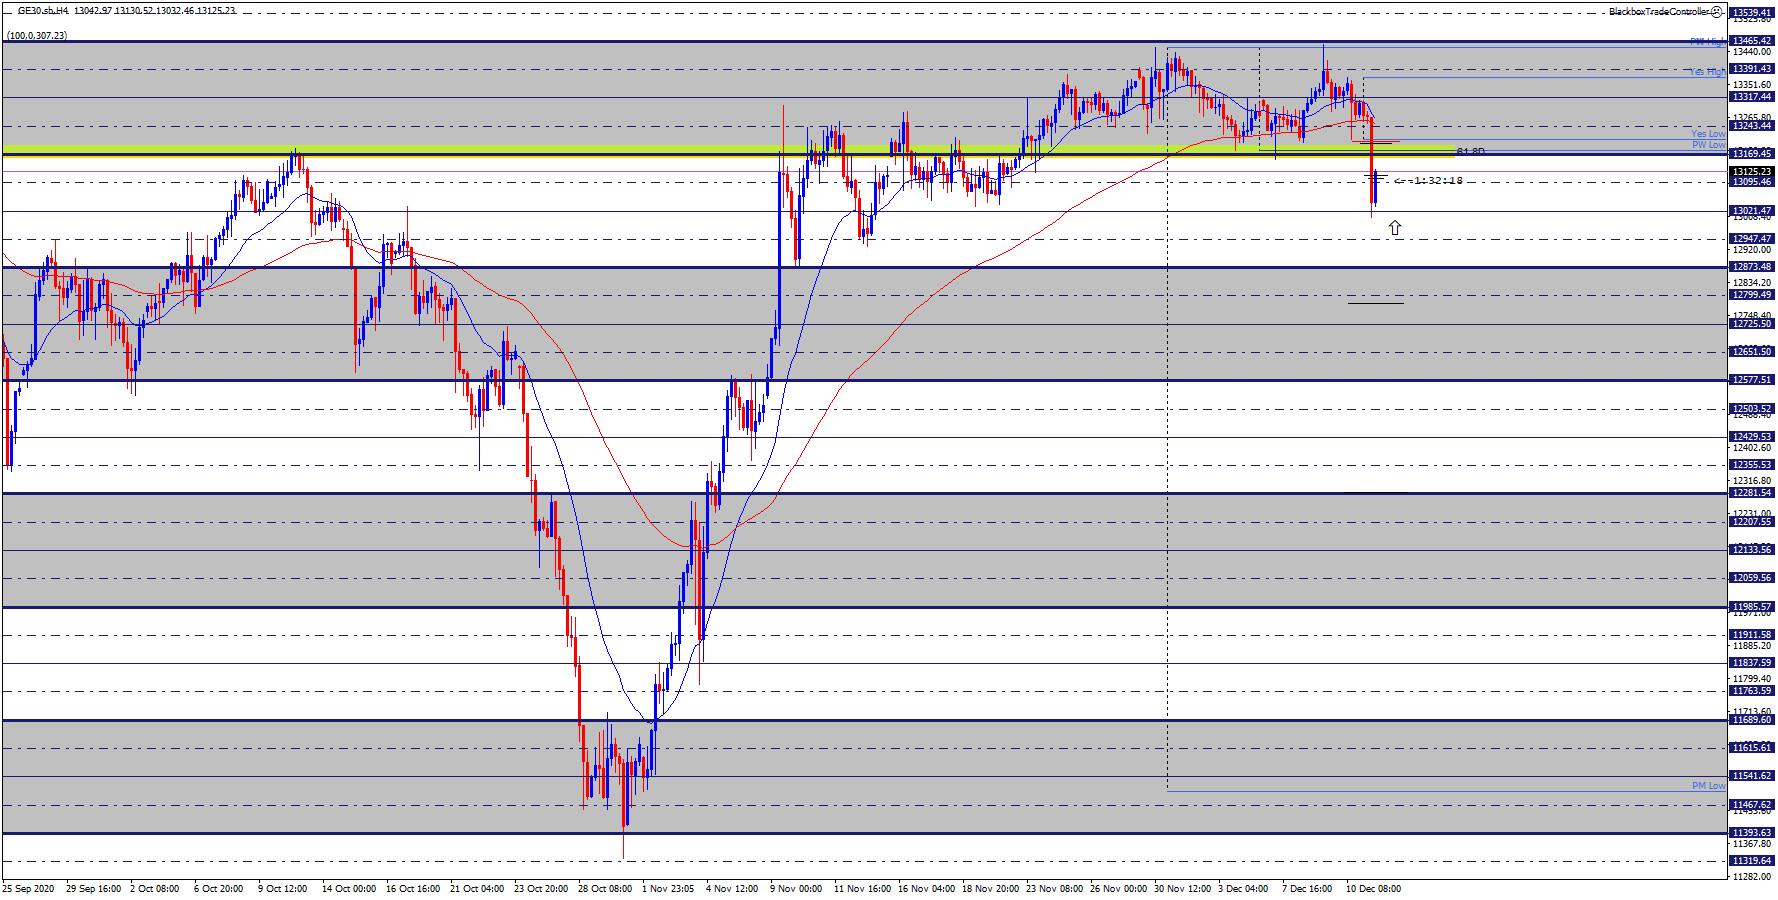
This first buy REVFIB offered an entry based on our rules, it moved into profit briefly before failing. Once the bears were able to sustain the break below 13169 price moved quickly down the EQZ 50% midline at 13021 where a second buy REVFIB formed.
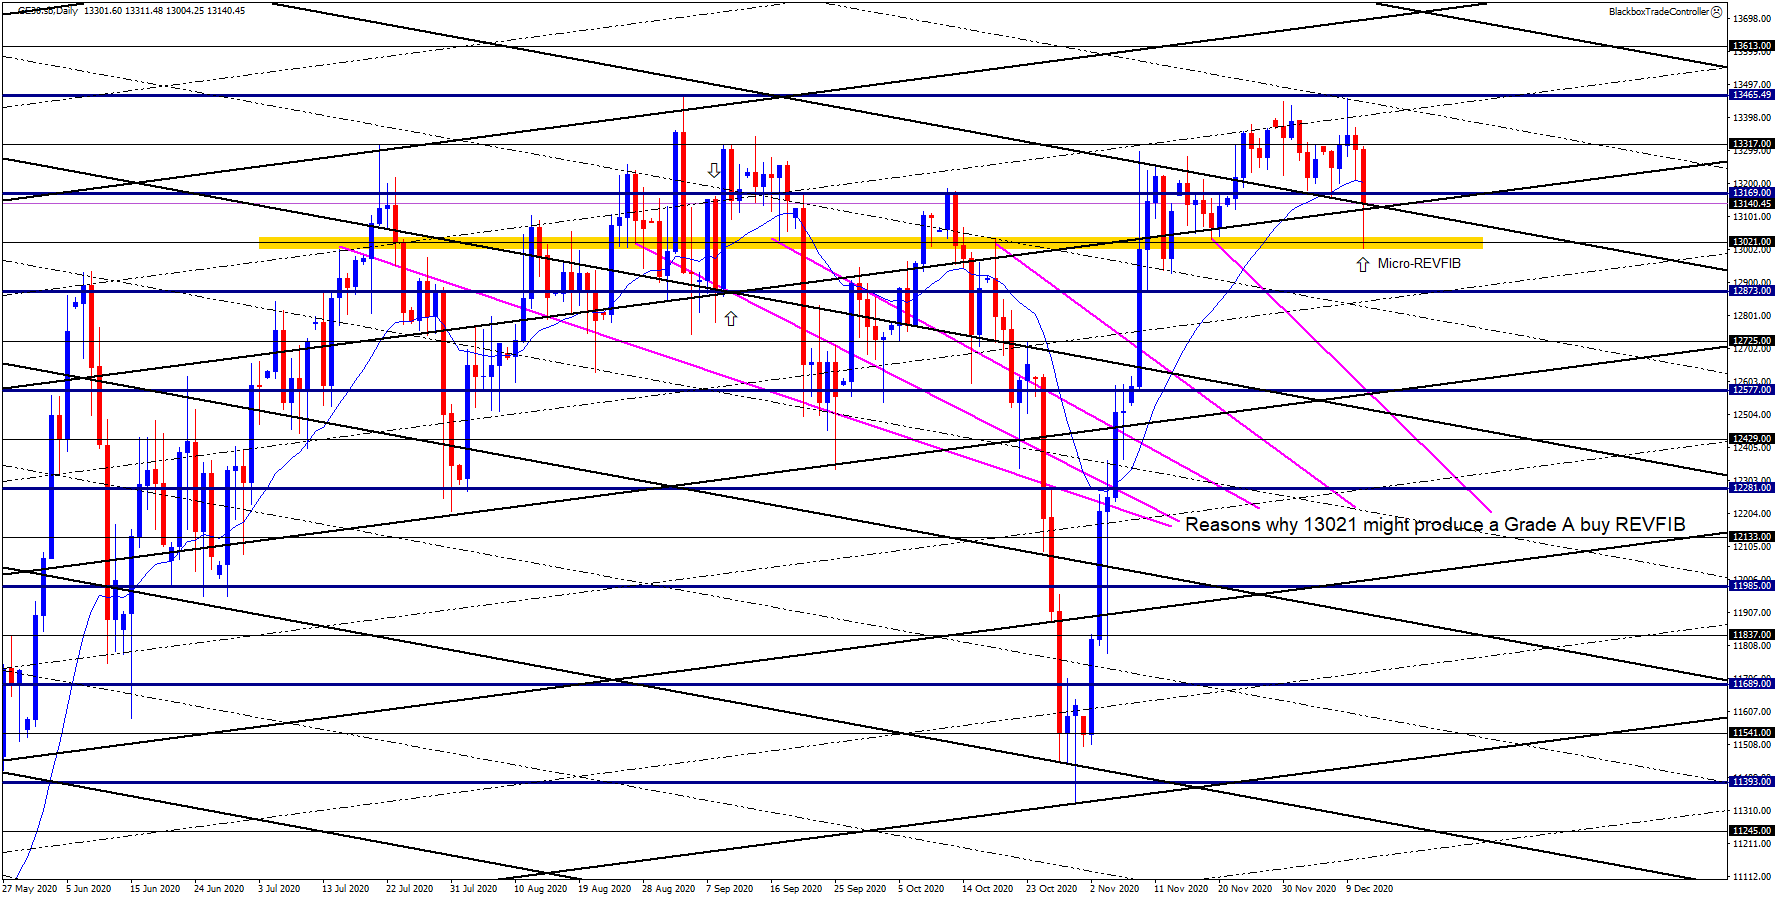
See the H4 and daily charts below to see why having the higher time frame Grid structure on display all the time is vital.
This time we did not see a DB but we did get a buy Micro-REVFIB, note:
- We did get a micro HH in relation to the last 15-20 candles at 13039
- The GZ was only 4 pips wide but had a very important RR point at 11:08, it was effectively an inverse Head & Shoulders pattern.
- The 50% level of the GZ was perfectly confluent with the 13021 level.
This is an example of where we don’t always get the perfect HH at the M5 MAB before price reverses back up. However, its structure was excellent along with the context based on the Grid.
Below is the H4 chart, this along with the daily chart highlighted that the 13021 Grid midline could be a possible reversal zone.
Below is the daily chart showing why we were expecting a possible reversal at 13021, follow the magenta lines to see the previous RR locations.
Below is the M5 chart showing what happened after the micro REVFIB 2 at 13021, price moved all the way back up to just below 13169, then:
- Formed a DT – Remember that REVFIBs which follow DTs or DBs are high probability setups.
- There was an aggressive sell REVFIB which can be clearly seen on the M1 chart, it is marked up.
- The sell REVFIB 3 had great structure and context, a 5 pip GZ, the RR was a Head & Shoulders pattern.
If point A is taken from the session Low (point A for REVFIB 2) and point B from the DB PB to 13160 look at the resulting GZ between 13063-13082 which held price and offered a buy setup.
The daily range was 307 pips and offered some clear tradeable price action patterns as compared with the previous several days where the daily range was only 100 pips or so. On the low range days, it was not easy getting 2R trades due to the compressed symmetry, however, REVFIBs did form at the TOR & BOR.
