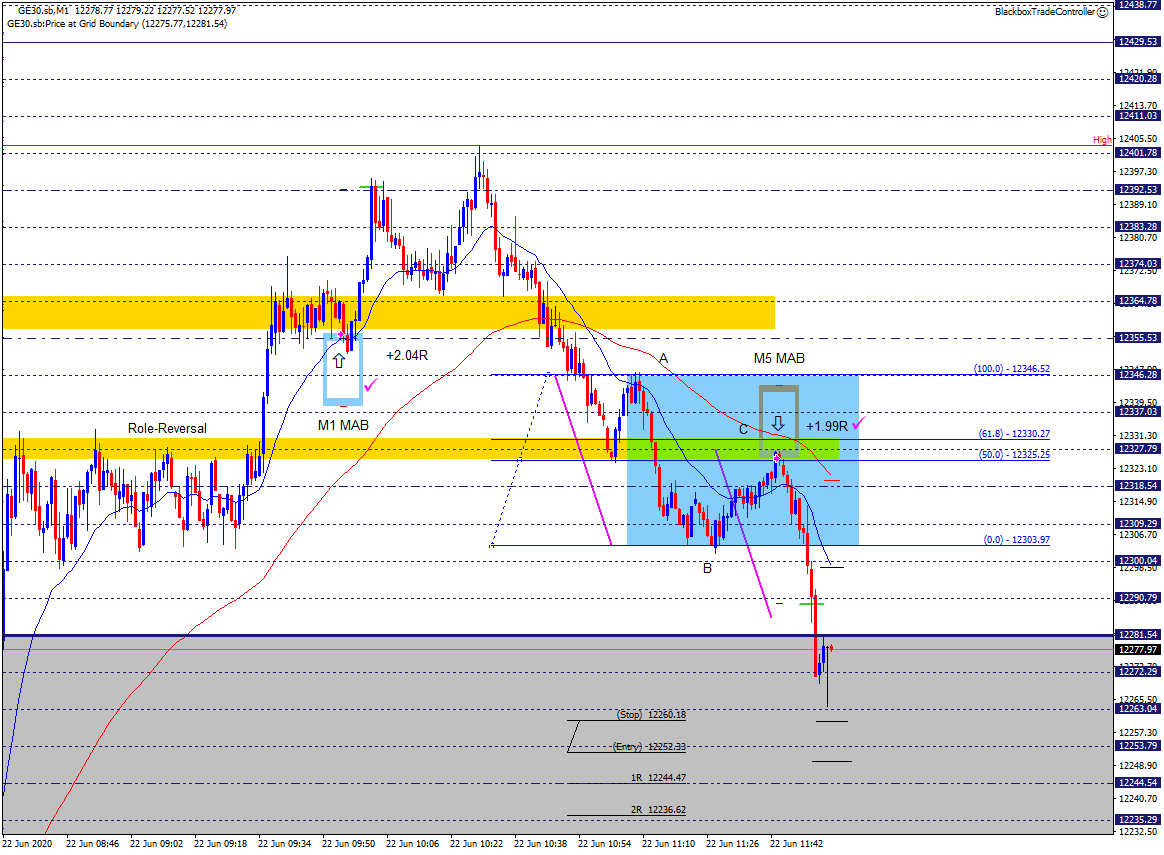
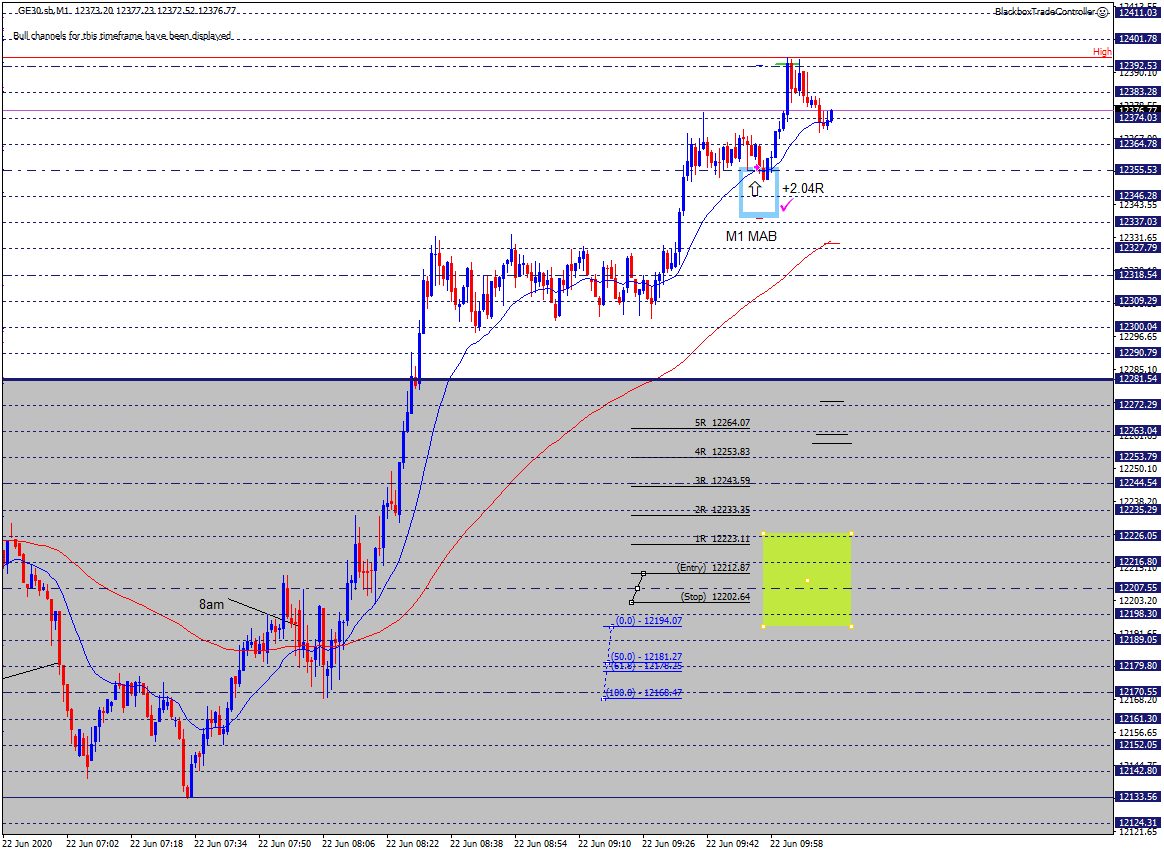
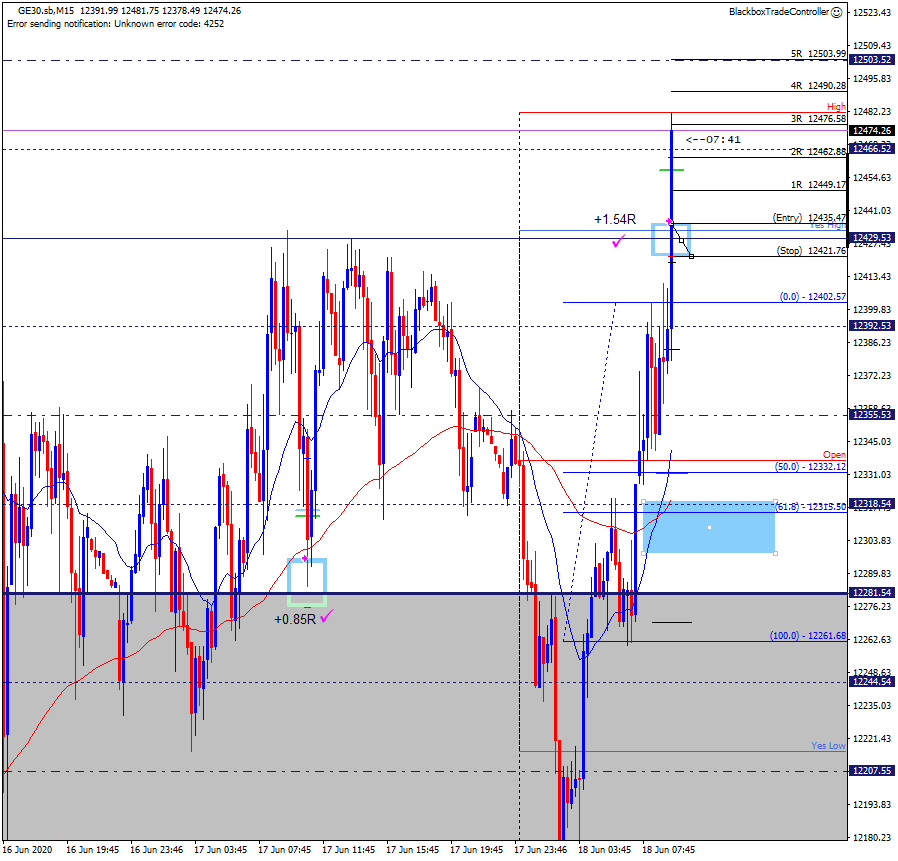
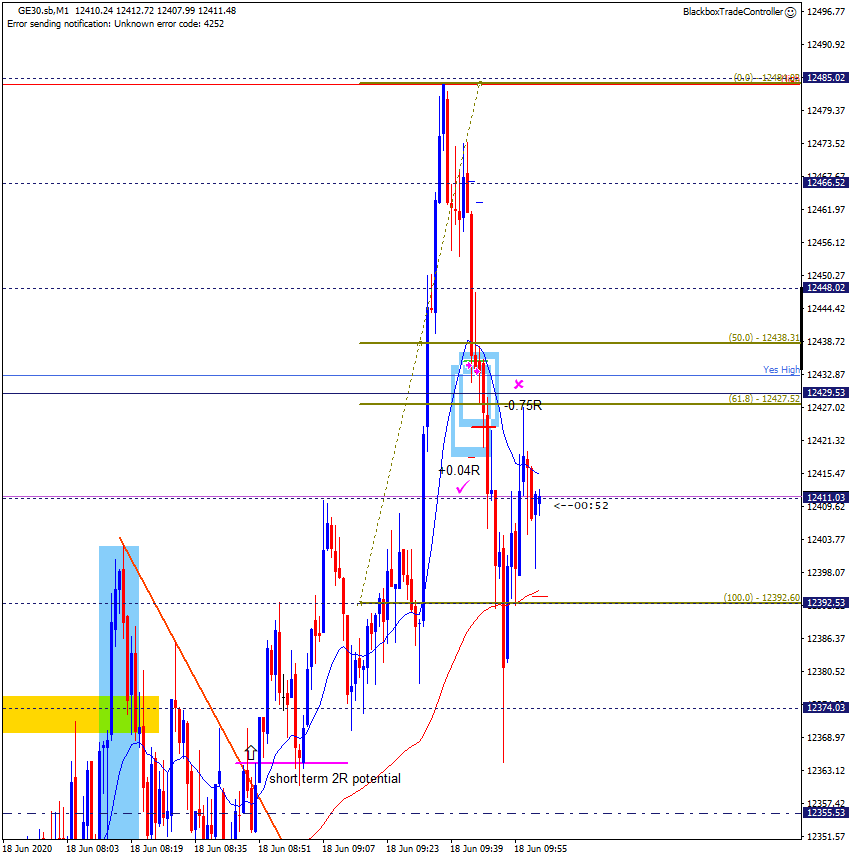
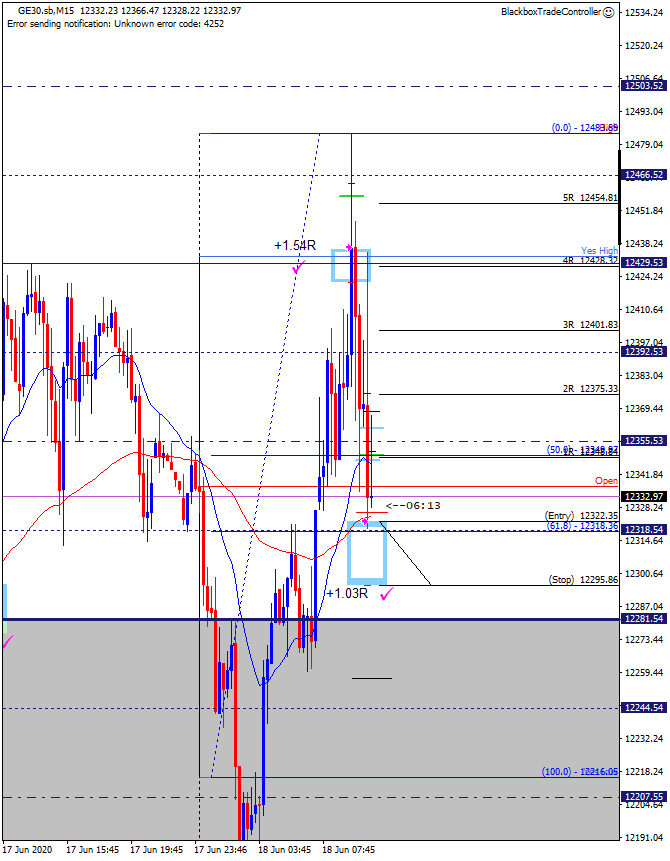
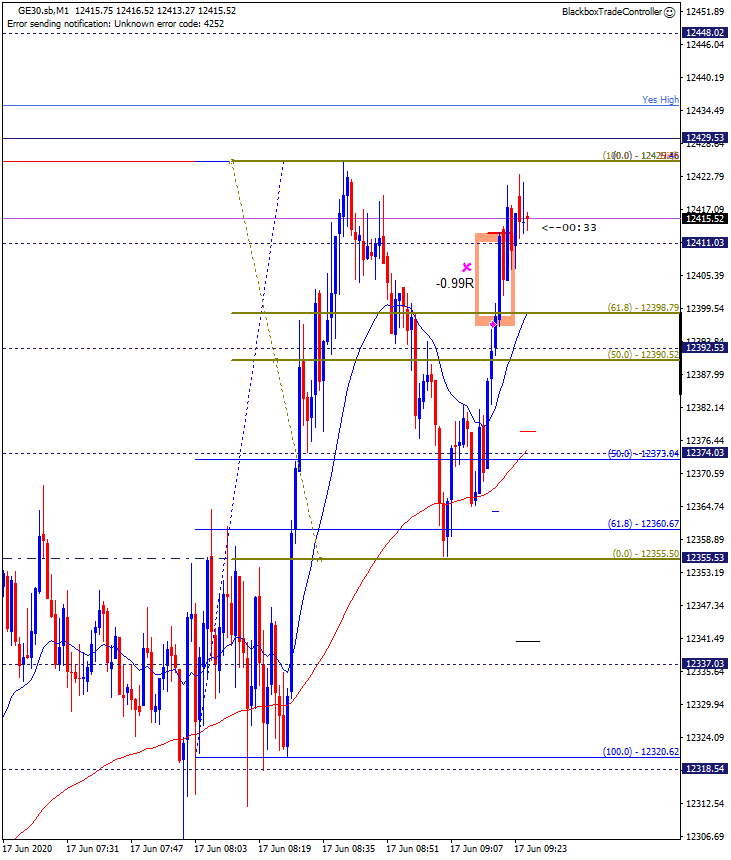
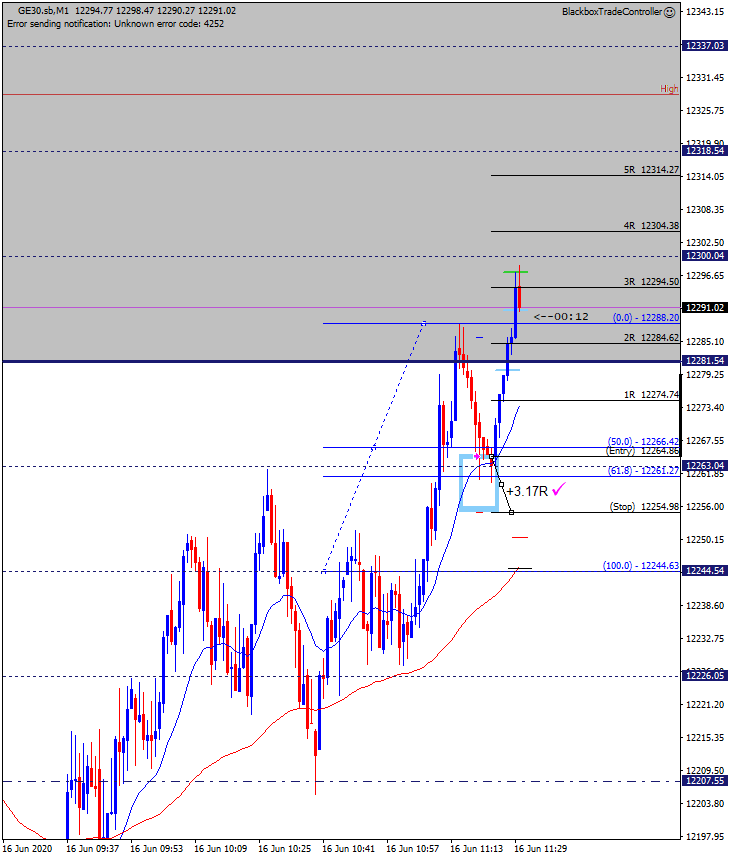
Very pleased with this trade and not just because it’s a winner.
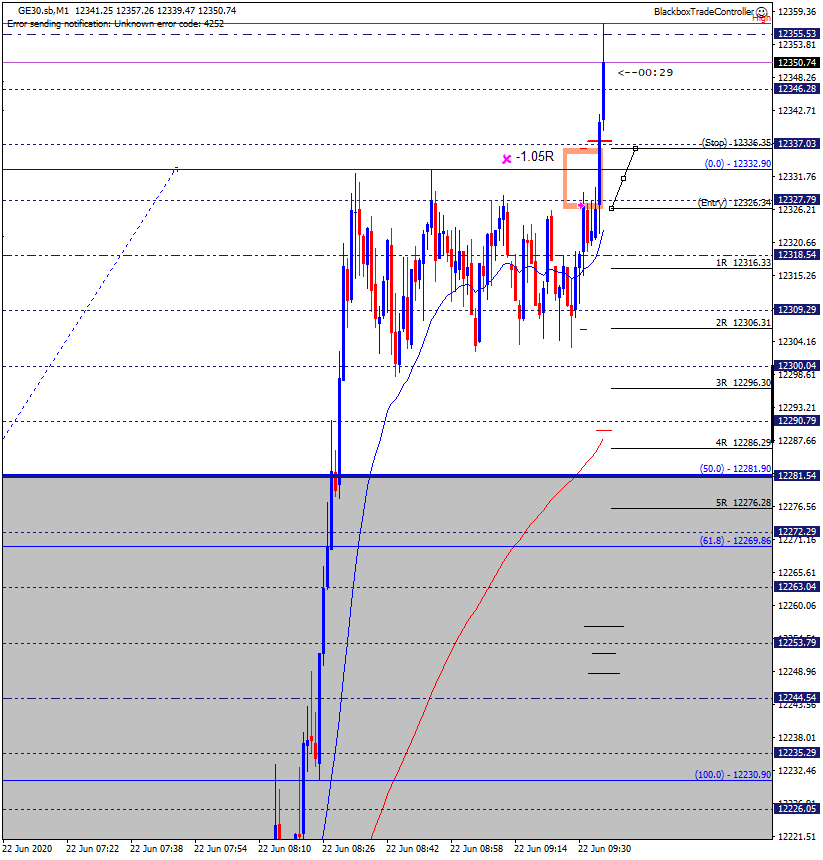
Today is my first day back trading for a few weeks due to the s/w updates etc. When I set up this morning I realized that I also have to get used to the updated Grid.
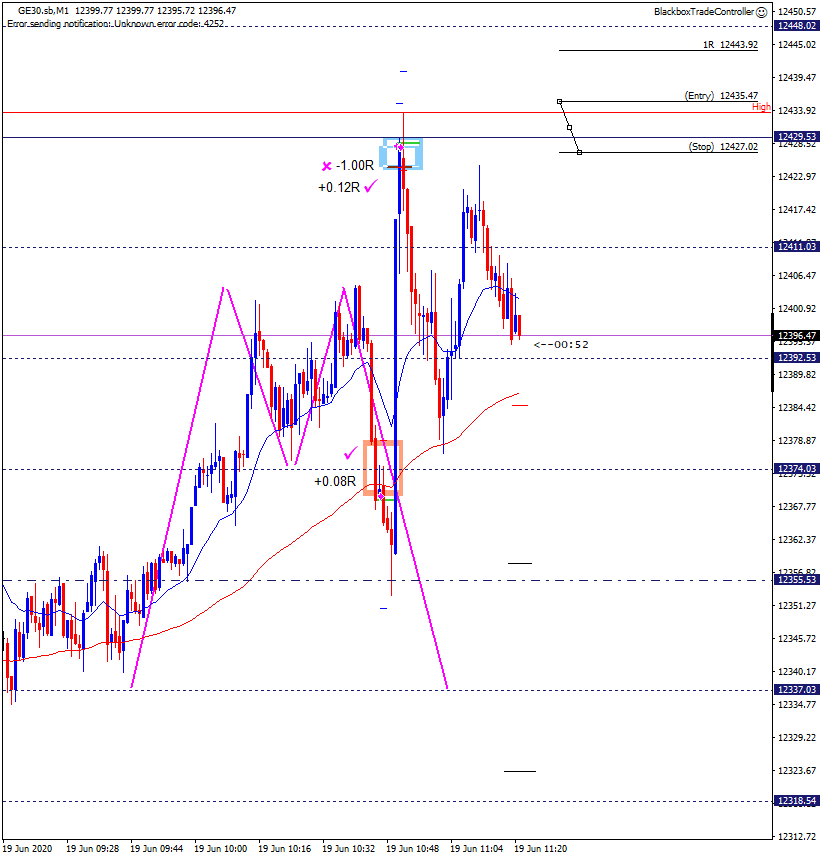
Note that /32 midlines are now displayed by default on the M1 time frame. The reason I added them is I noticed there were other micro-levels in play, switch to the M1 time frame, and scroll left. To see what level a midline is hover the mouse over it. They can be removed if preferred but it’s worth getting used to them. On some of the Forex charts such as the EURUSD they are very clear and add an additional level of granularity when trading the M1 and M5 time frames.
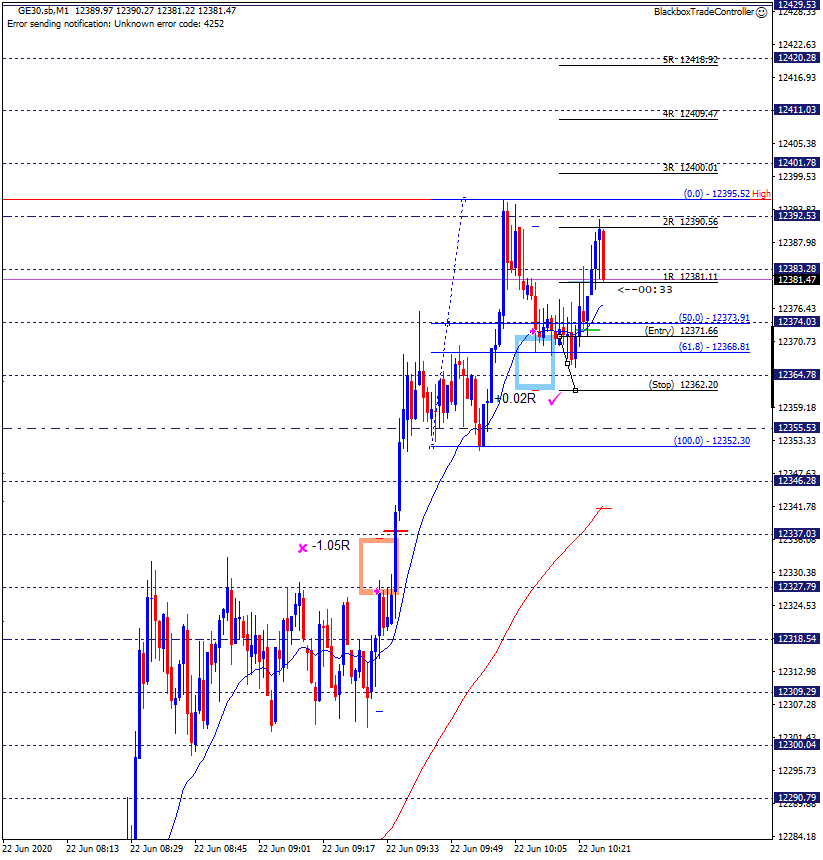
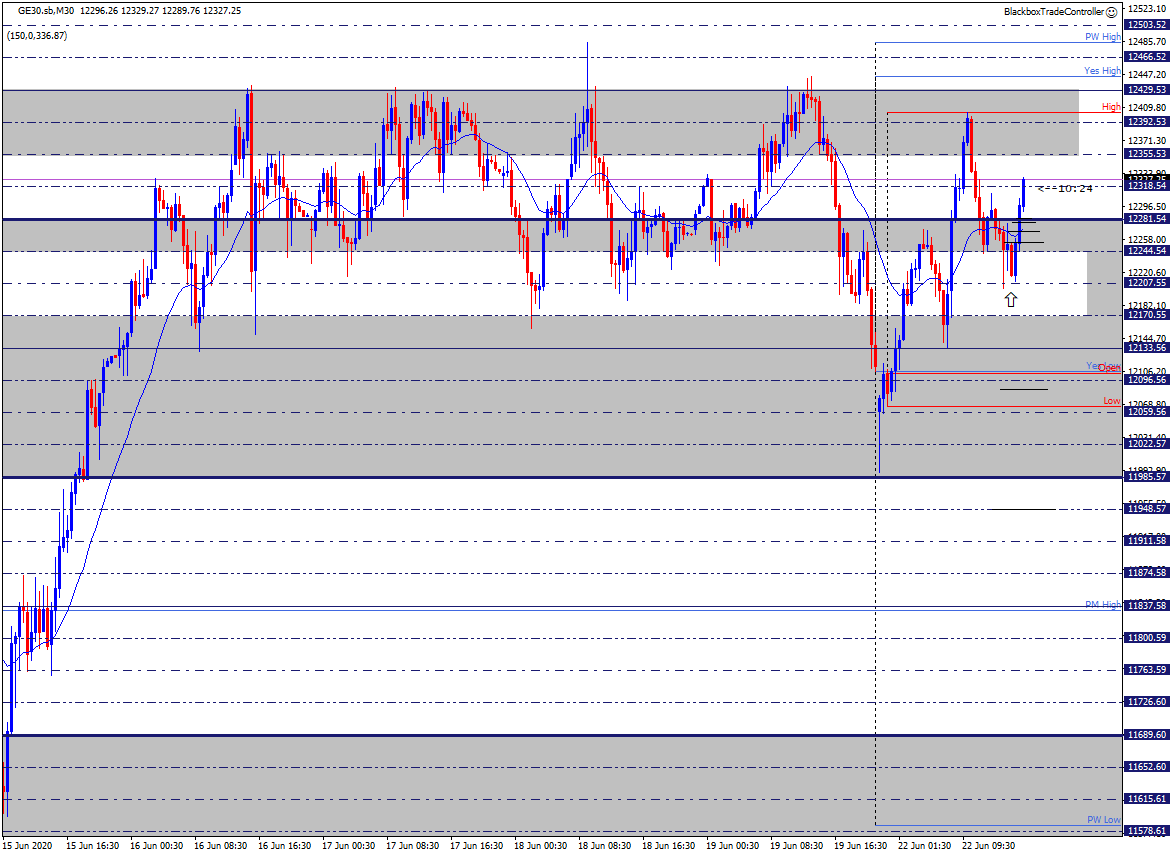
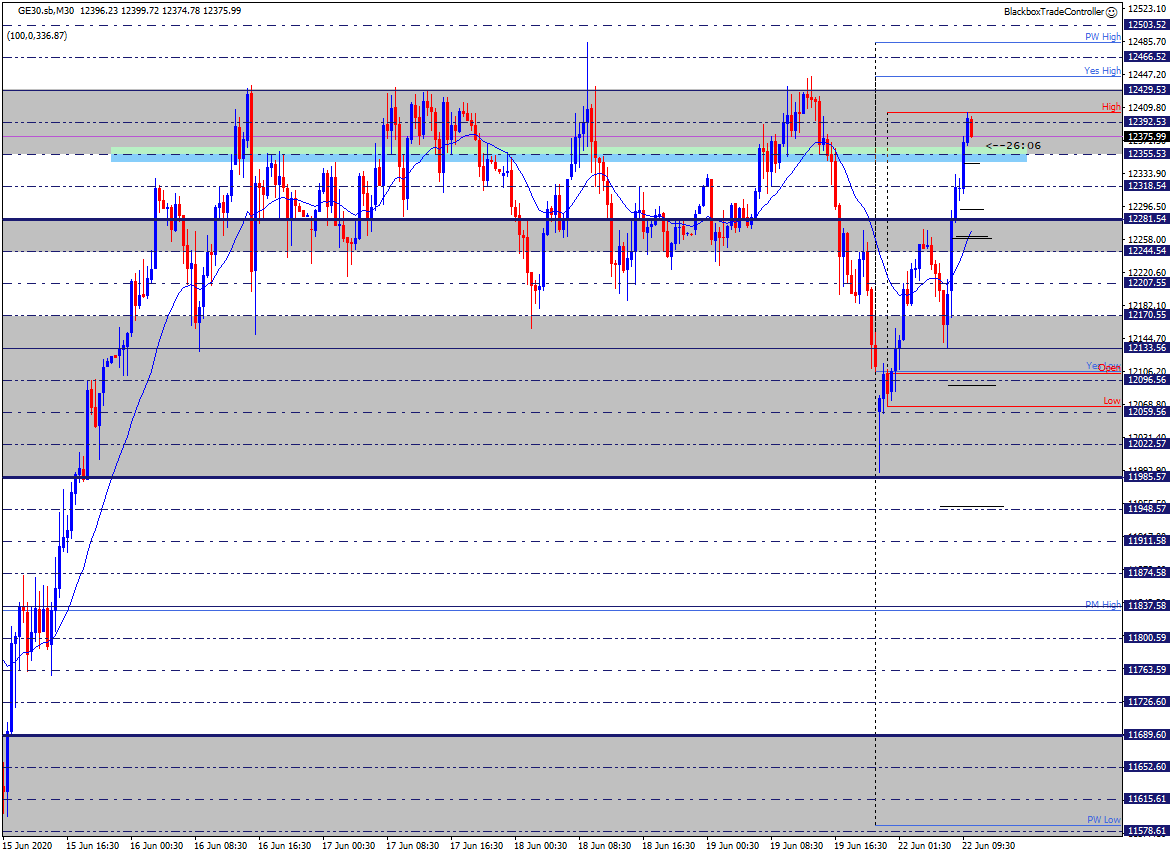
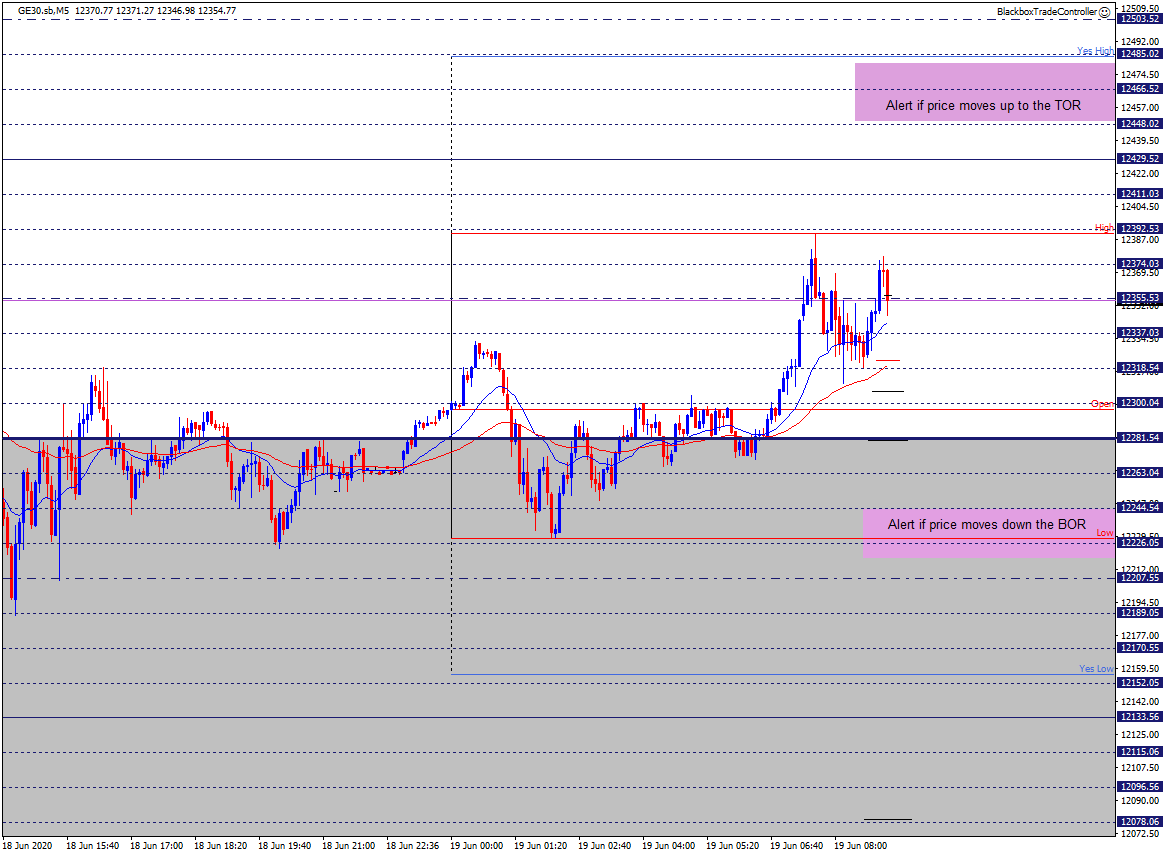
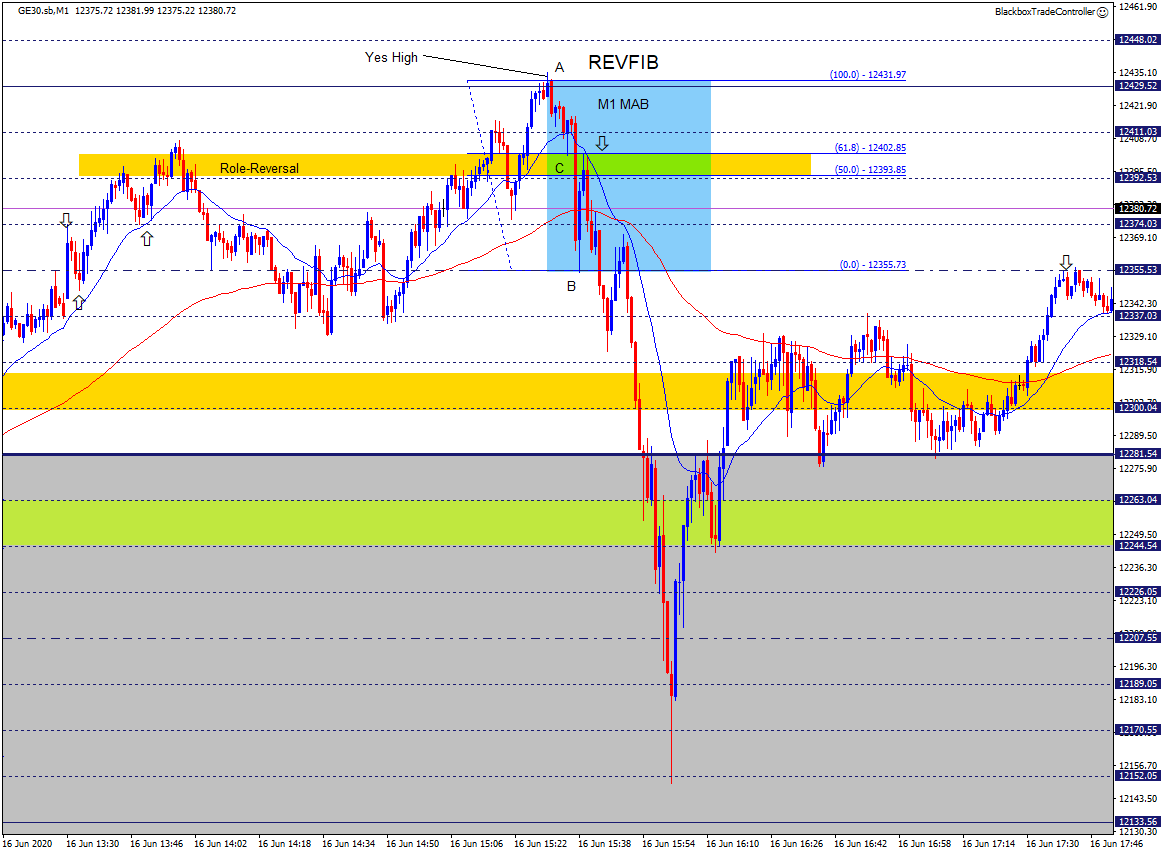
When I noticed that price had broken and closed above the 12355 level I watched see what happened. Looking at my higher time frame install I had the M30 chart displayed and it showed VERY clearly how important this midline was – see the screenshot below.
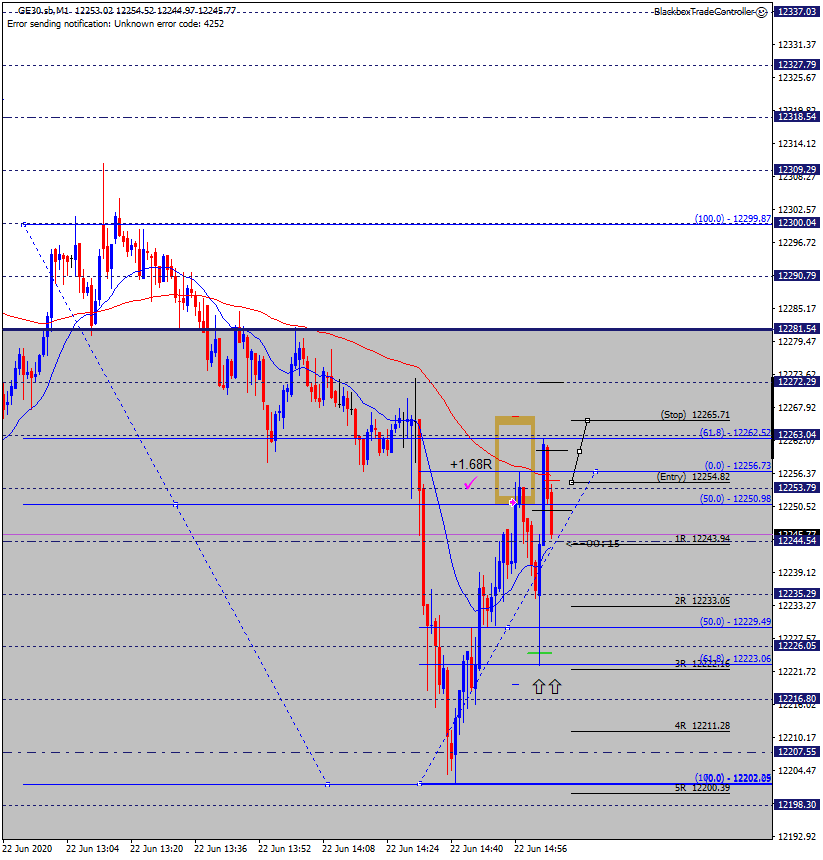
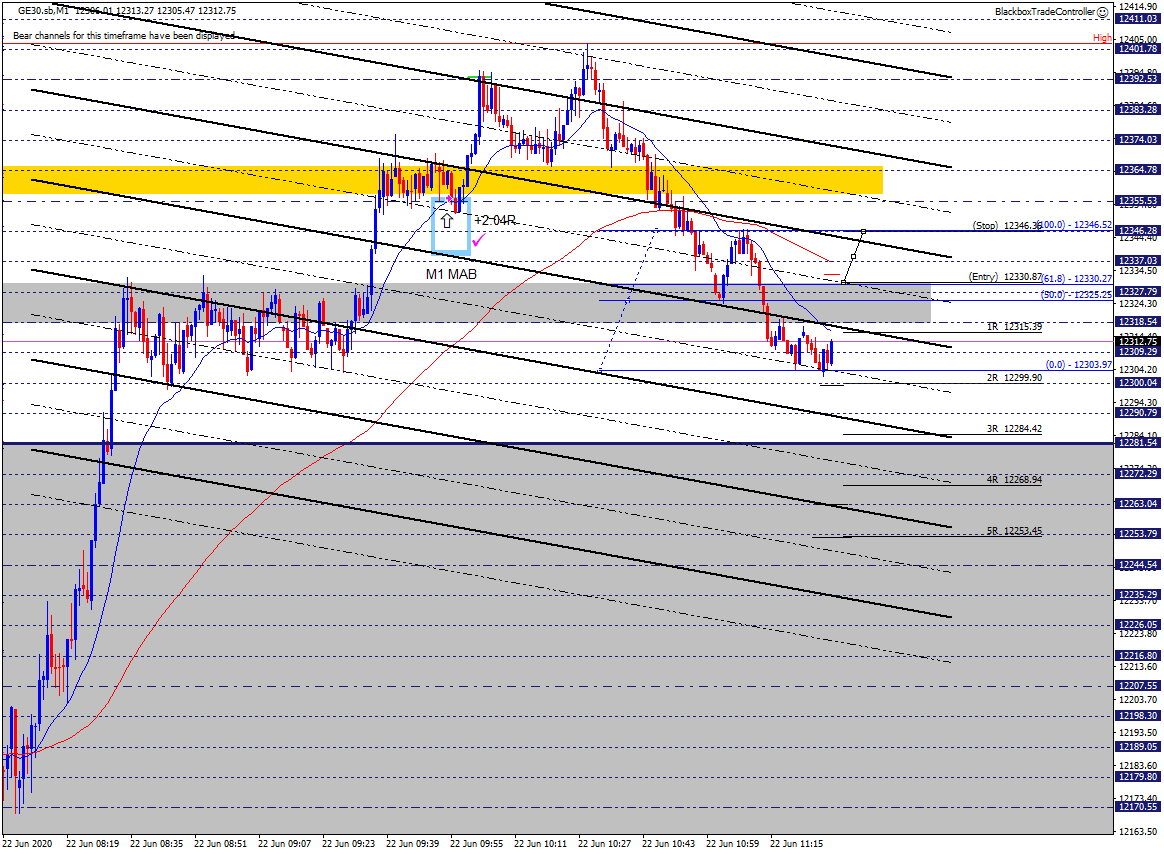
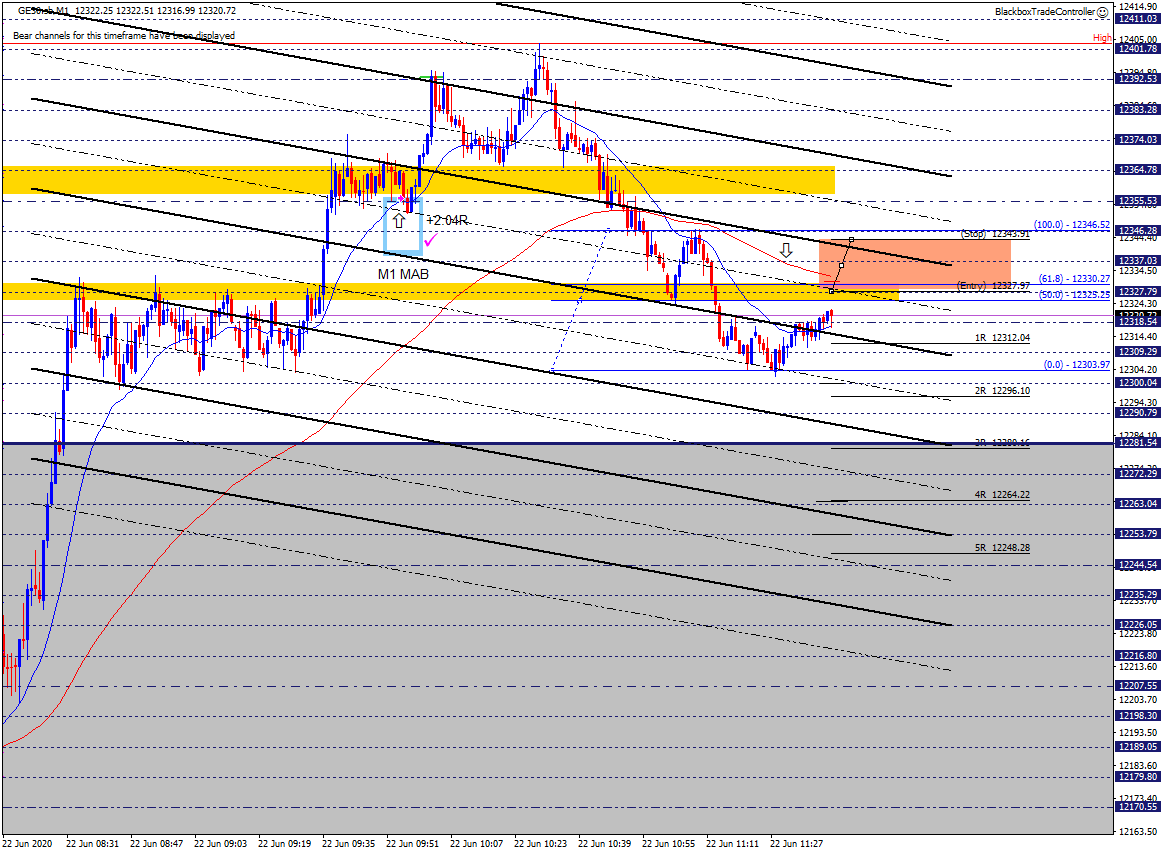
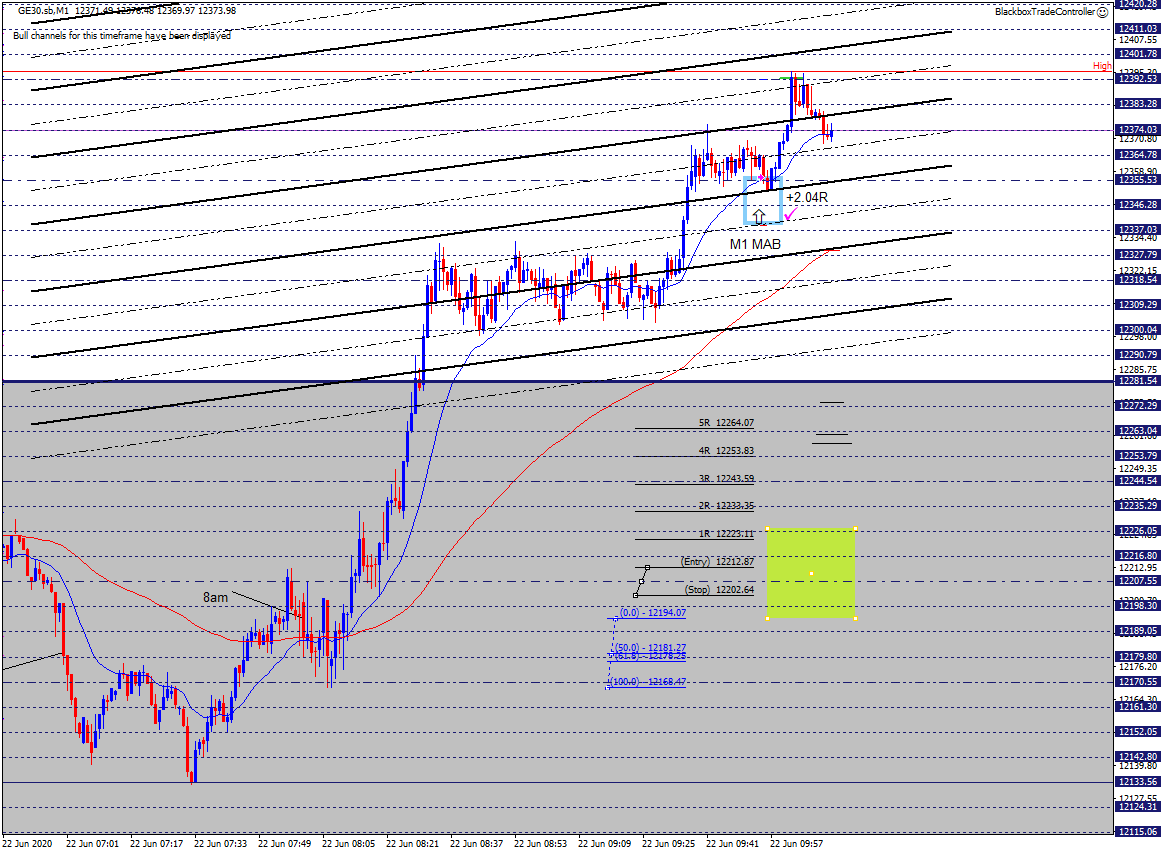
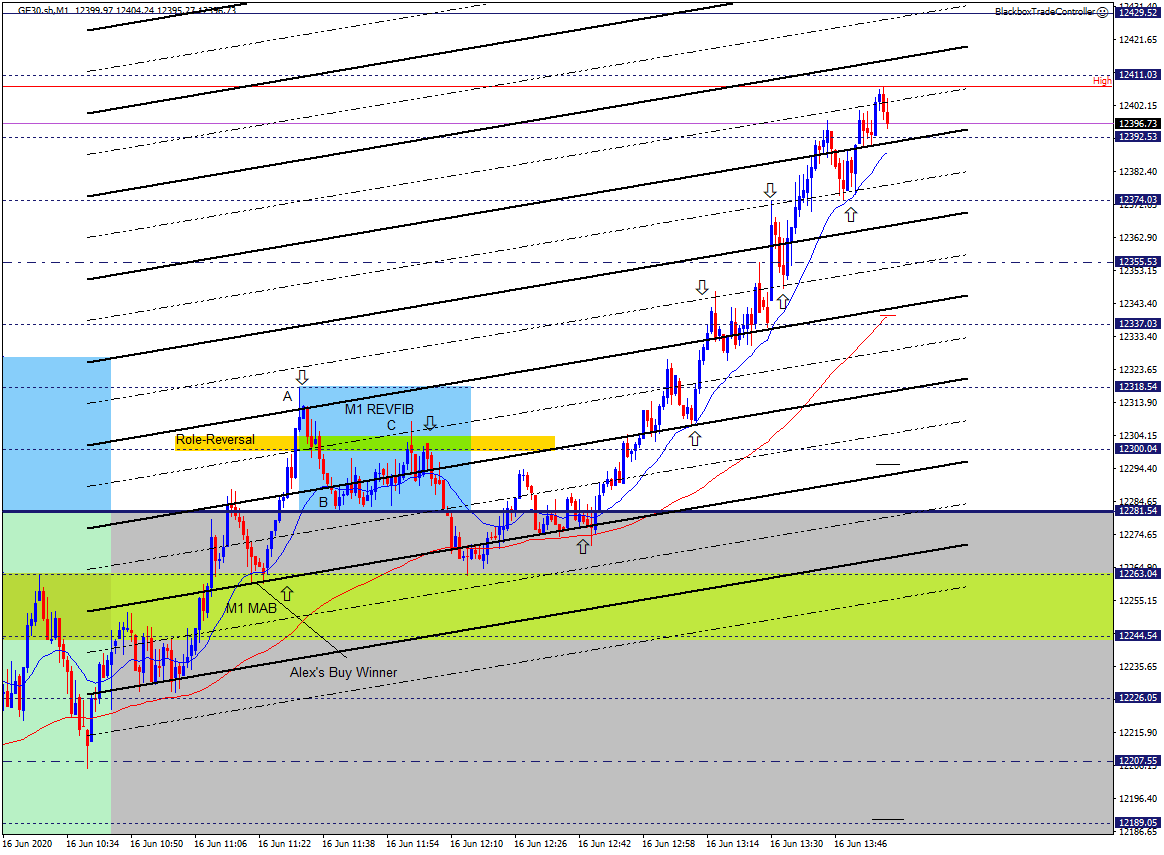
When price began to build a micro-base on this level I overlaid the M1 Bull Channels to see a channel boundary supporting a buy trade – see the screenshot below.
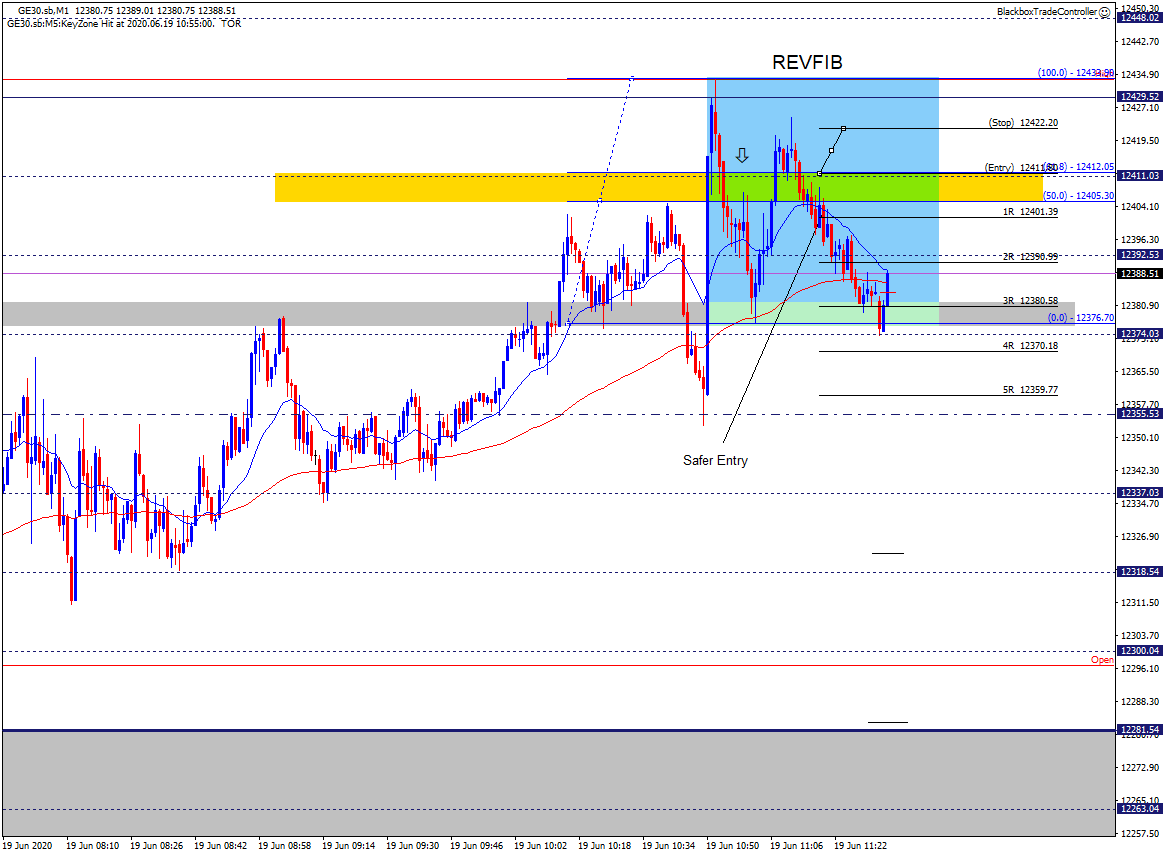
So when price pulled back to the level and channel boundary I took the buy trade, my target was right on the 12392 midline, 7:17 minutes later it came in 🙂
So even though this was not a textbook A-B-C pullback to a very clear GZ I used the updated Grid (horizontal structure first then followed by the M1 Bull channels to look for additional confluence) to guide me. We have something very unique with the Grid, I firmly believe that learning to trust it will lead to profitability and mastery!
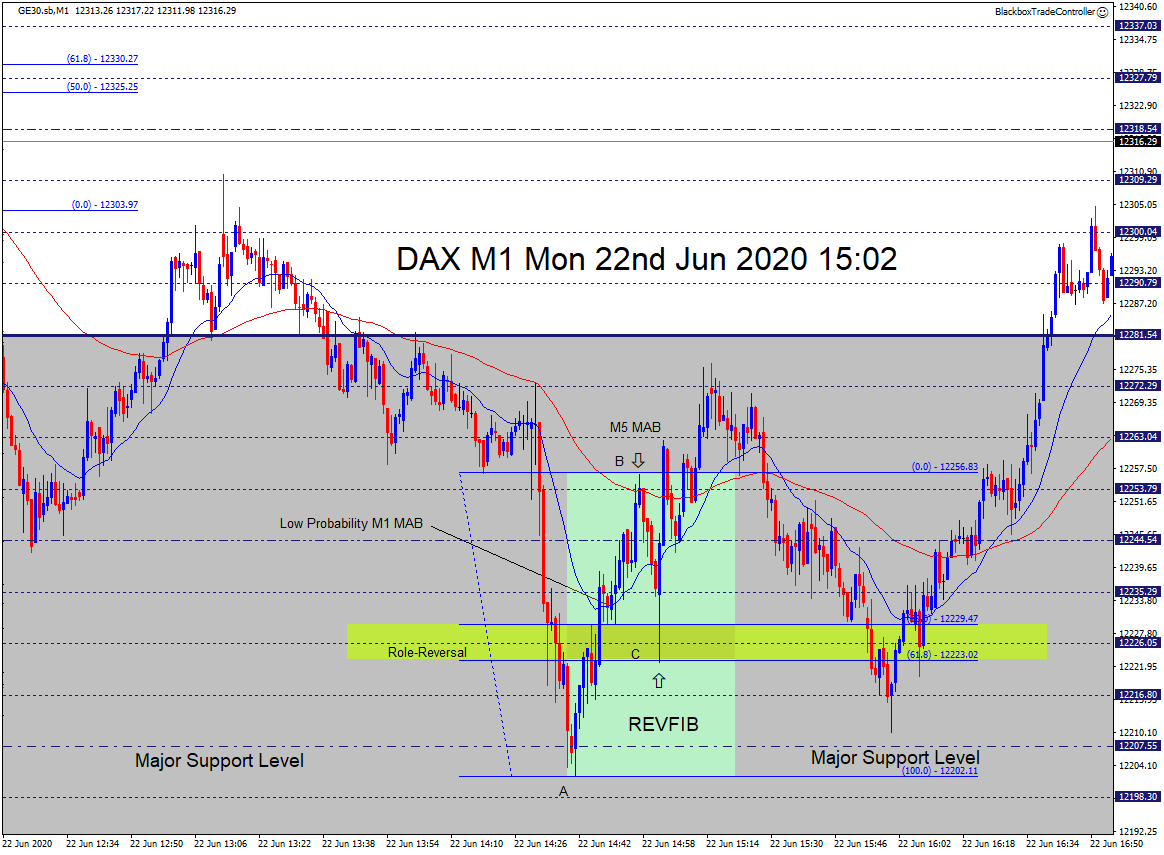
See the two screenshots below, one with the channels overlaid, the other is the M30 chart I was using to support the trade. I’ve highlighted the 12355 level to show how precise and important it is.

